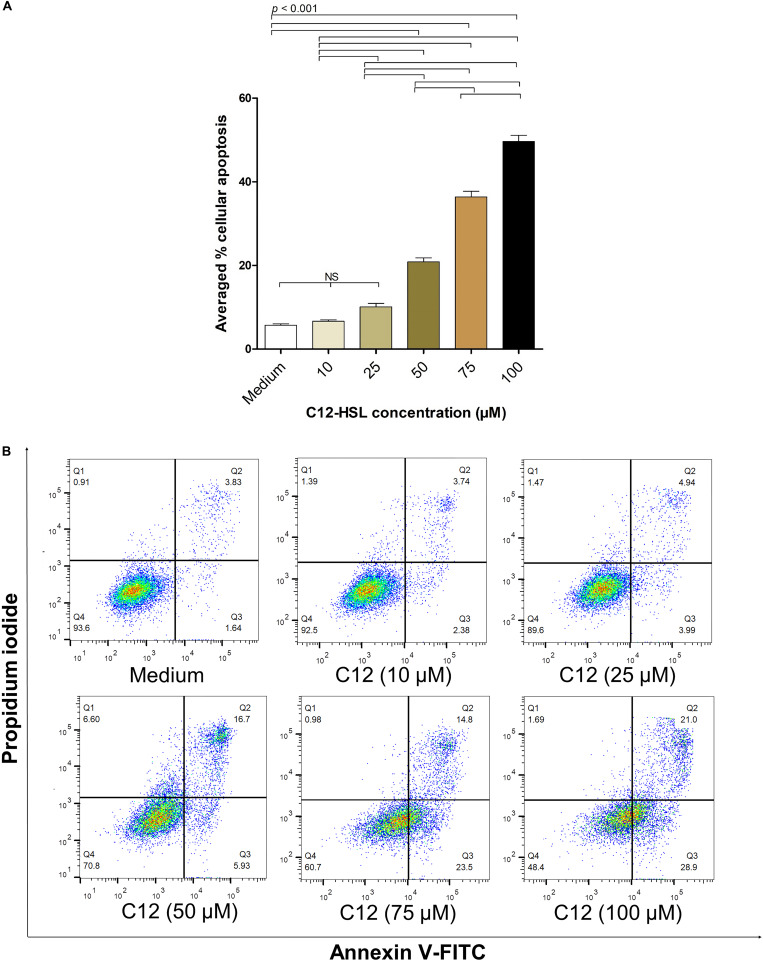
FIGURE 4.
The percentages of apoptotic HeLa cells exposed to different concentrations of 3O-C12-HSL. (A) Bar graph of average percentages (means ± SD) of apoptotic cells from three independent experiments after exposure to 10, 25, 50, 75, and 100 μM of C12-HSL, compared with the cells in medium alone. (B) The density plots of HeLa cells after treatment with 10, 25, 50, 75, and 100 μM of C12-HSL, and control cells stained by Annexin V-FITC/PI and subjected to flow cytometric analysis (representative of three independent experiments). The cytotoxic activity of the 3O-C12-HSL was dose-dependent. Q1, necrotic cells (Annexin V negative/PI positive); Q2, late apoptotic cells (Annexin V positive/PI positive); Q3, early-apoptotic cells (Annexin V positive/PI negative), and Q4, viable cells (Annexin V negative/PI negative).

