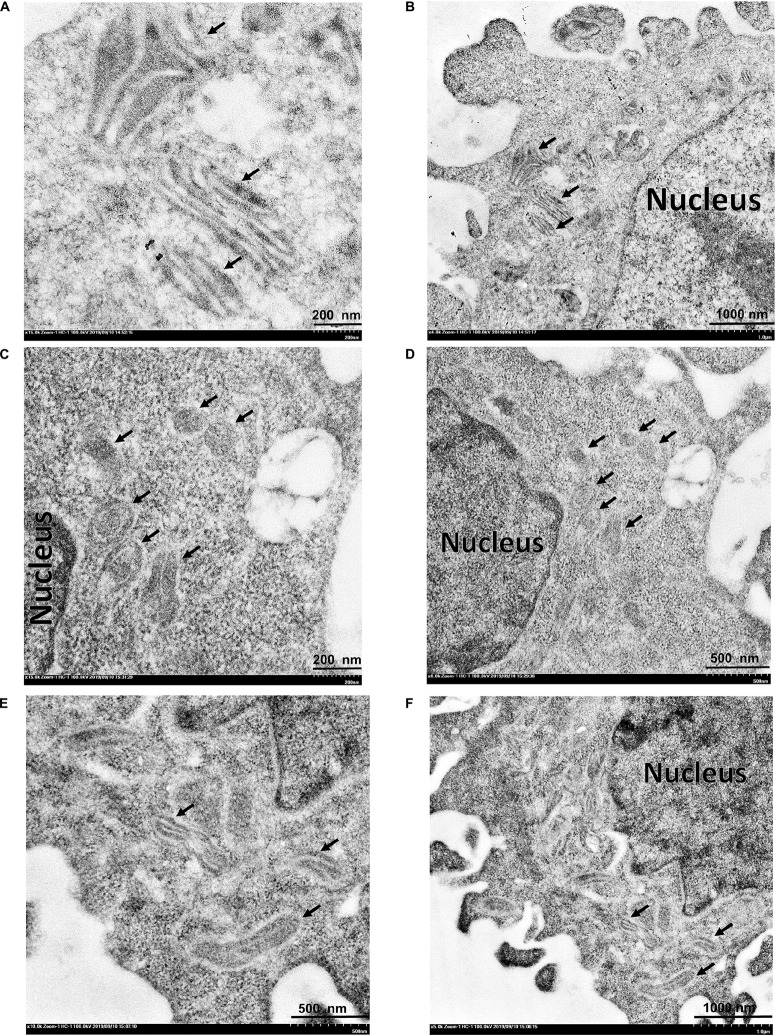
FIGURE 8.
Transmission electron micrographs of mitochondrial ultrastructure. (A,B) normal mitochondria of HeLa cells. (C,D) HeLa cells treated with 3O-C12-HSL (50 μM). (E,F) HeLa cells treated with a mixture of 50 μM 3O-C12-HSL and 2 μM HuscFv-F19. Black arrows indicate mitochondria of the HeLa cells. Mitochondria of the cells exposed to the 3O-C12-HSL were swollen, characterized by a size increment with decreased electron density of the crista-free matrix.

