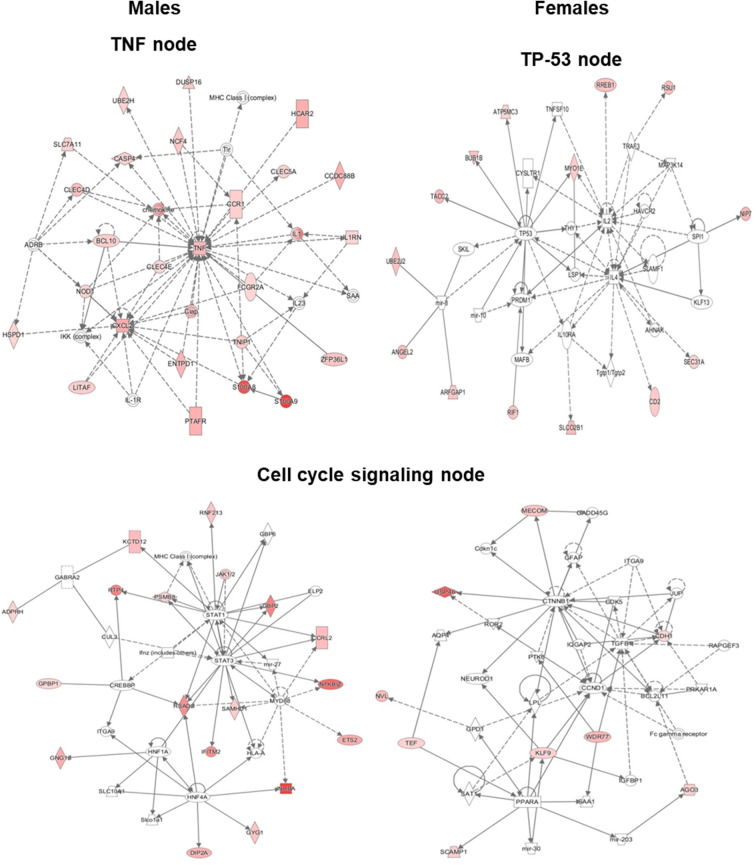
Figure 5.
Ingenuity pathway analysis (IPA). The diagram depicts biological networks of genes whose expression was ≥2-fold (shown in color) in the AMs of SP-A2 (1A0) males vs. females at the 6 h post-infection time point. The diagram shows reported direct (solid lines) and indirect (dashed lines) interactions for these genes. (Left) genes and pathways in male mice; (Right) genes and pathways in female mice. Each gene or group of genes is represented as a node. Molecules that are significantly altered ≥2 are represented as node in red. Node shapes represent functional classes of gene products: Square for cytokines, Concentric (double) circle for complex/group, Diamonds for enzymes and peptidases, Ovals for transcription regulators and transmembrane receptors, Triangle for phosphatases and kinases, Rectangles for ligand-dependent nuclear receptors, G-protein coupled receptors, and ion channels, Trapezoids for transporters and microRNAs.

