FIGURE 5.
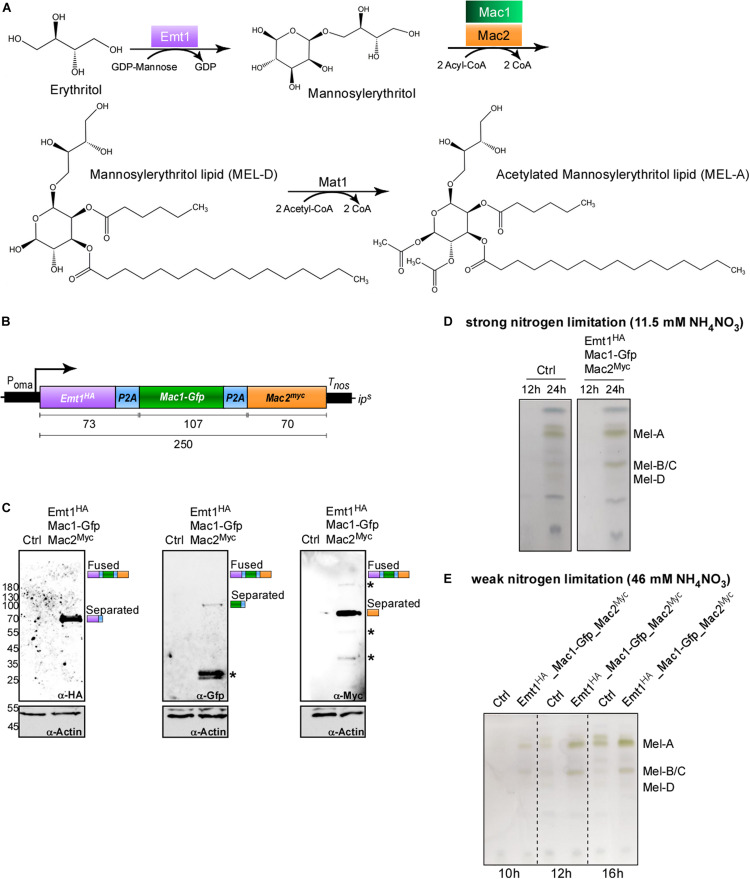
Usage of P2A enables production of biosurfactants. (A) Metabolic MEL synthesis pathway in U. maydis. GDP-mannose is added to an erythritol moiety by the mannosyl transferase Emt1 (purple) with consumption of GDP, resulting in the formation of mannosylerythritol. C2 and C3 positions are acylated with C2-C18 fatty acid chains. This step is catalyzed by the acyl transferases Mac1 (green) and Mac2 (orange) and results in the formation of the deacetylated variant MEL-D. MEL-D is acetylated in positions C4 and C6 by the acetyl transferase Mat1, resulting in the formation of MEL-A (C4 and C6 acetylated), MEL-B (C6 acetylated, not shown) and MEL-C (C4 acetylated, not shown). (B) Schematic representation of tri-cistronic expression construct for MEL-D production using cytoplasmic versions of Mac1 and Mac2: constitutively active promoter (Poma), ORF encoding Emt1 fused to HA tag (purple, Emt1HA), L2 fused to P2A (blue, P2A), Mac1 fused to Gfp (green, Mac1-Gfp), L2 fused to P2A (blue, P2A) Mac2 fused to a myc tag (orange, Mac2myc), transcriptional terminator (Tnos). (C) Western blot analysis of protein synthesis via tri-cistronic mRNA (antibodies are given at the bottom, size of marker proteins in kDa at the left, asterisks indicate protein degradation). (D) Thin layer chromatography of glycolipids from whole cells under conditions of strong nitrogen limitation. (E) Thin layer chromatography of glycolipids from whole cells under conditions of weak nitrogen limitation (progenitor strain MB215rua1Δ, Ctrl).

