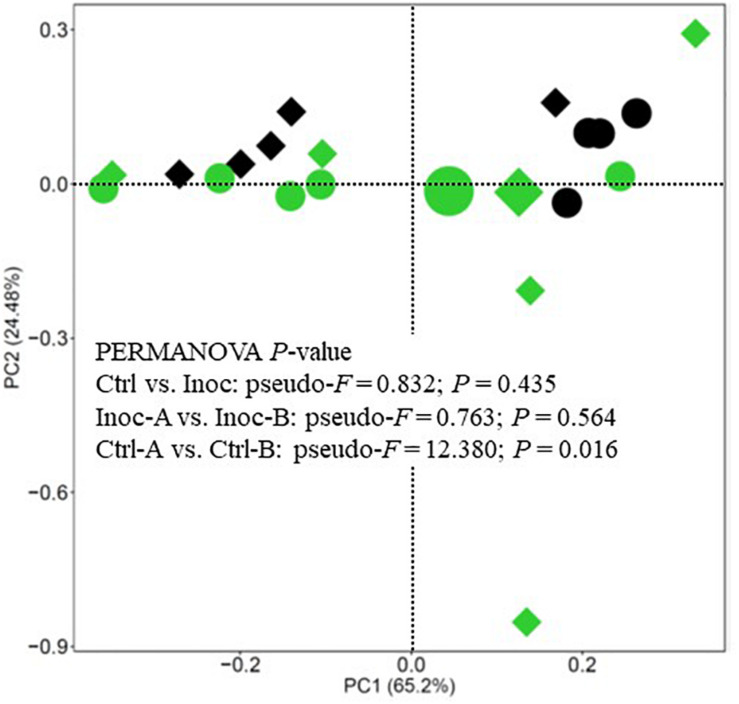
FIGURE 3.
PCA plot showing the overall comparison of predicted functional features of the rumen microbiota (based on KEGG Orthology database). Large green circle, Inoc-A donor; small green circles, Inoc-A calves; large diamond, Inoc-B donor; small green diamonds, Inoc-B calves; small black circles, Ctrl-A calves; small black diamonds, Ctrl-B calves. Data of the donors for the control calves were not shown.

