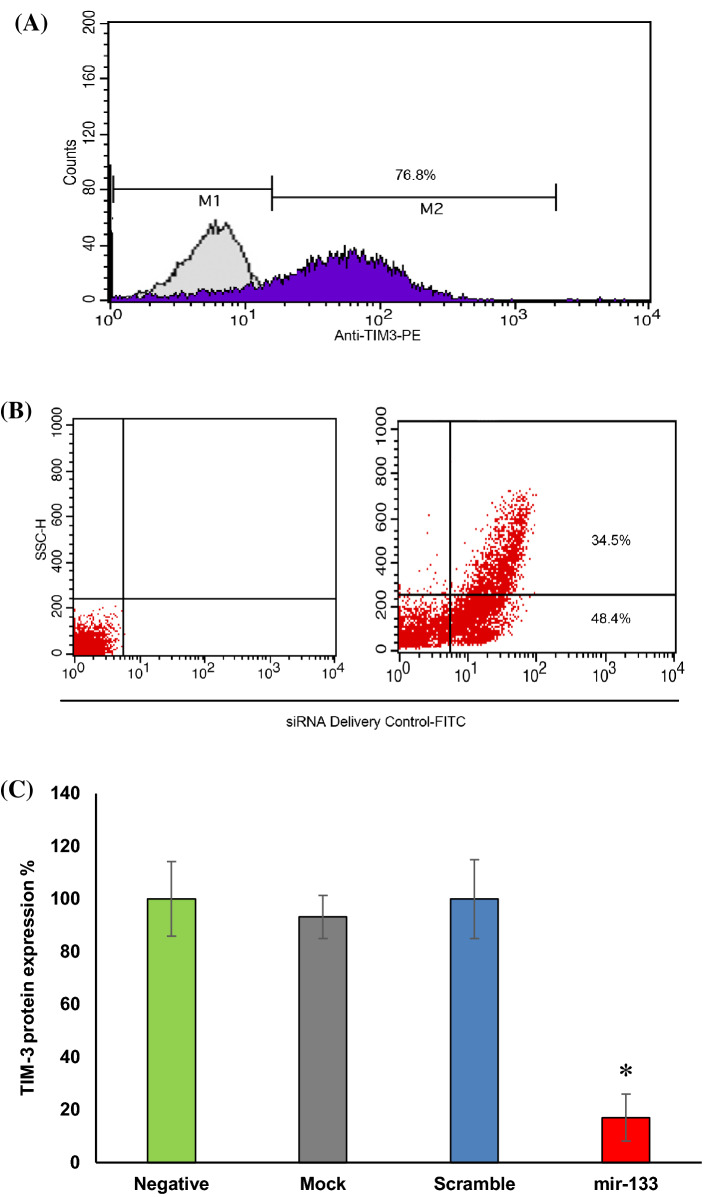
Fig. 3.
Flow cytometry analysis. a The histogram represents that 76.8% of the HL-60 cells were expressed TIM-3 protein after PMA treatment. b The histogram demonstrates the 82.9% successful transfection of the cells with FITC labeled siRNA. c The graph indicates the significant suppression of TIM-3 protein expression (p < 0.05) after cells transfection with miR133a-5p mimic in comparison to the negative control. Among the negative, mock, and scrambled groups no significant difference was observed. The asterisk (*) represents statistical significance

