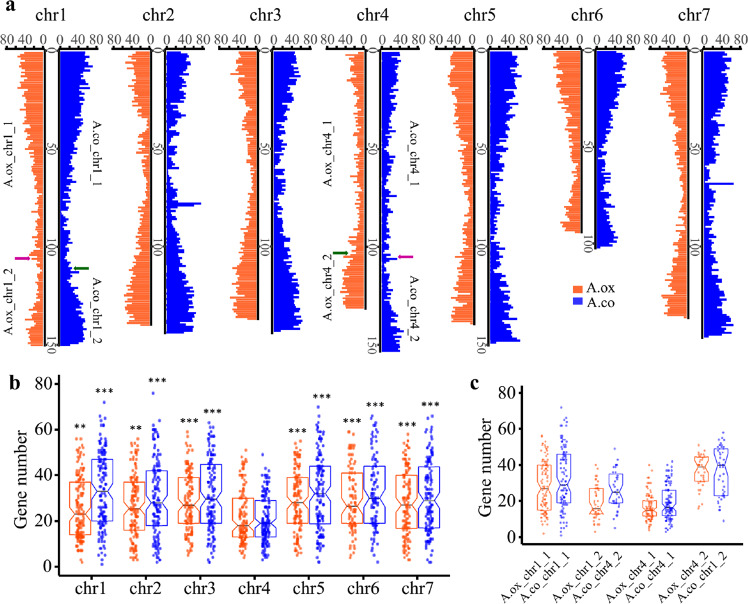
Fig. 6. Distribution and significance test of gene density.
a Distribution of gene number in each 300 kb window. The arrows on chromosomes 1 and 4 designate rearrangement breakpoints. Pink arrows show that A.ox_chr1_2 is homologous to A.co_chr4_2, while dark-green arrows show the homology of A.ox_chr4_2 with A.co_chr1_2. b Boxplot of gene density on each chromosome. Each point represents the number of genes in a 300 kb window. In the boxplots, each box indicates the lower quartile, median, and upper quartile values. Pairwise significance tests between Chr4 and the other chromosomes within each species were performed. Asterisks indicate significance level: **P < 0.01, ***P < 0.001. Detailed P value for each comparison is provided in Table S10. c Gene density on different homologous fragments. Detailed P value for each comparison is provided in Table S12

