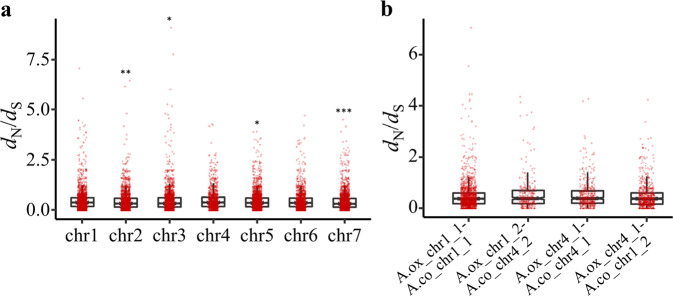
Fig. 7. Distribution and significance test of dN/dS values.
a Boxplot of dN/dS values calculated between one-to-one orthologs. Genes were assigned to different chromosomes according to the A. oxysepala var. kansuensis genome. Pairwise significance tests between Chr4 and the other chromosomes were performed. Asterisks indicate significance level: *P < 0.05, **P < 0.01, ***P < 0.001. Detailed P value for each comparison is provided in Table S11. b Boxplot of dN/dS values for one-to-one orthologs distributed on the rearranged chromosome segments. Detailed P value for each comparison is provided in Table S13

