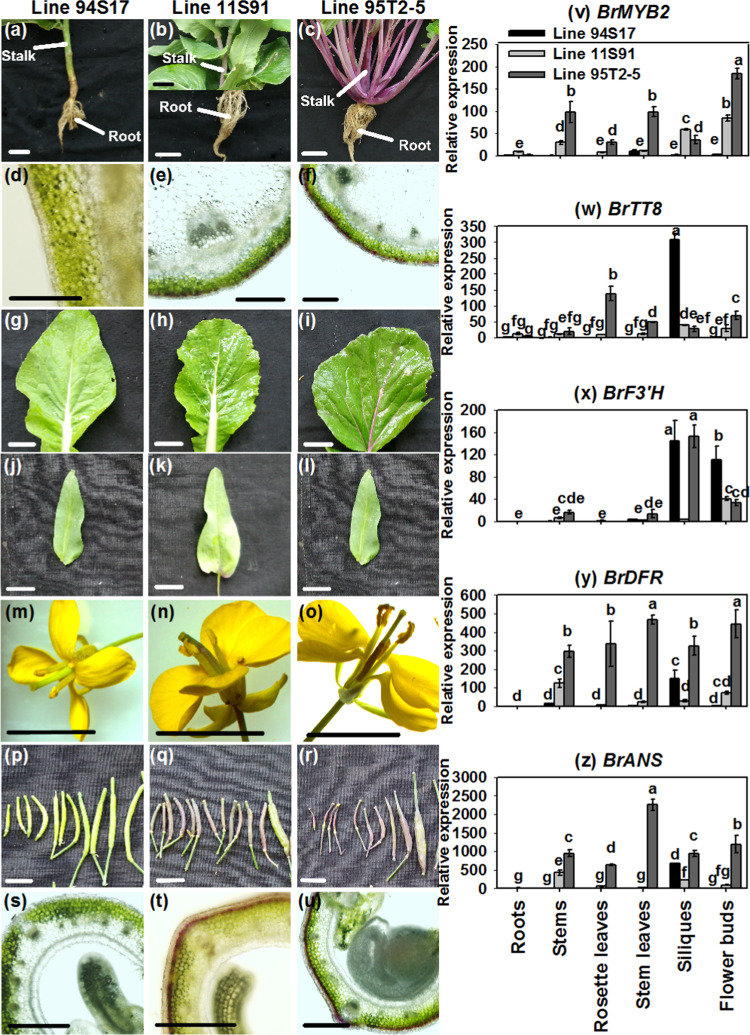
Fig. 3. Expression patterns of BrMYB2 and related ABGs in different tissues.
a–u Phenotypes of different tissues of three Chinese cabbage lines; the images in each vertical sample column (left to right) were collected from 94S17, 11S91, and 95T2-5. a–c Stalks and roots. d–f Transection of stems. g–i Rosette leaves. j–l Stem leaves. m–o Flowers. p–r Siliques. s–u Transection of siliques. v–z Gene expression patterns. The rosette leaves of 94S17 were treated as controls in the data analysis; the values are presented as the means ± SDs (n = 3). The different letters above each column are significantly different at p < 0.05 according to Duncan’s test. The scale bar is 1.5 cm in (a–c) and (g–t) and 200 μm in (d–f) and (s–u).

