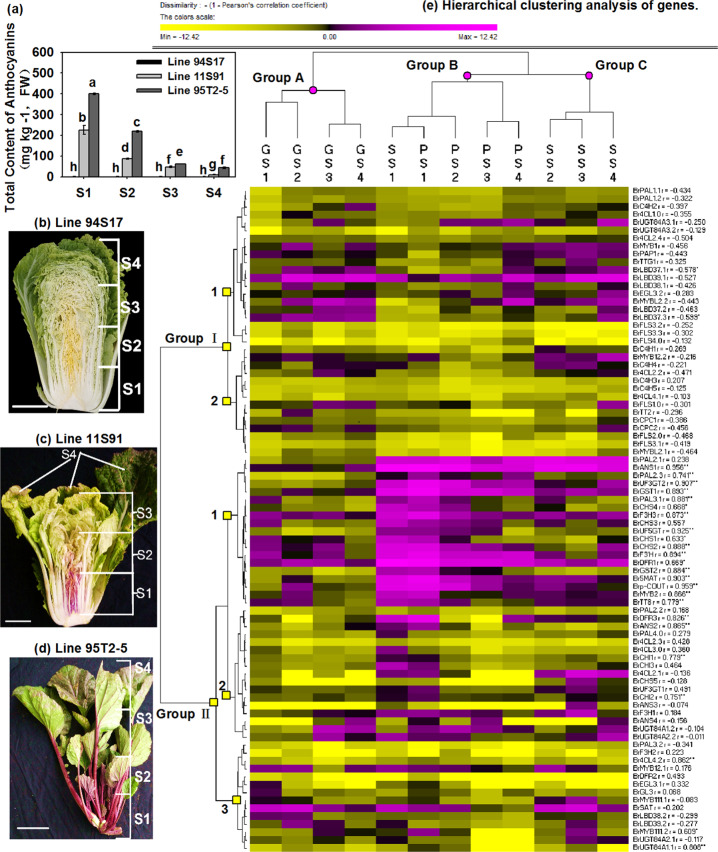
Fig. 4. Total anthocyanin content and expression patterns of ABGs in Chinese cabbage at the head-formation stage.
a Total anthocyanin content of samples; the values are presented as the means ± SDs (n = 3), and the different letters above each column are significantly different at p < 0.05 according to Duncan’s test. b–d The head of 11S91 was divided into four parts: S1, the interior heading leaves with deep purple color; S2, the interior leaves with light purple color; S3, the exterior heading leaves; S4, the outer functional leaves. The leaf size and positions of the 94S17 and 95T2-5 samples were the same as those of 11S91. e Hierarchical clustering analysis of gene expression patterns. The expression data were log2-normalized, clustered using PermutMatrix software61 and analyzed with the Pearson distance and Ward’s method. The magenta boxes indicate upregulation, and the yellow boxes indicate downregulation; the color brightness is directly proportional to the expression ratio. The first capital letters ‘G’, ‘P,’ and ‘S’ are different leaf tissues of 94S17, 95T2-5, and 11S91, respectively. The relative coefficient ‘r’ with ‘*’ and ‘**’ indicates that gene expression is significantly and highly significantly correlated with total anthocyanin content at the levels of 0.05 and 0.01, respectively

