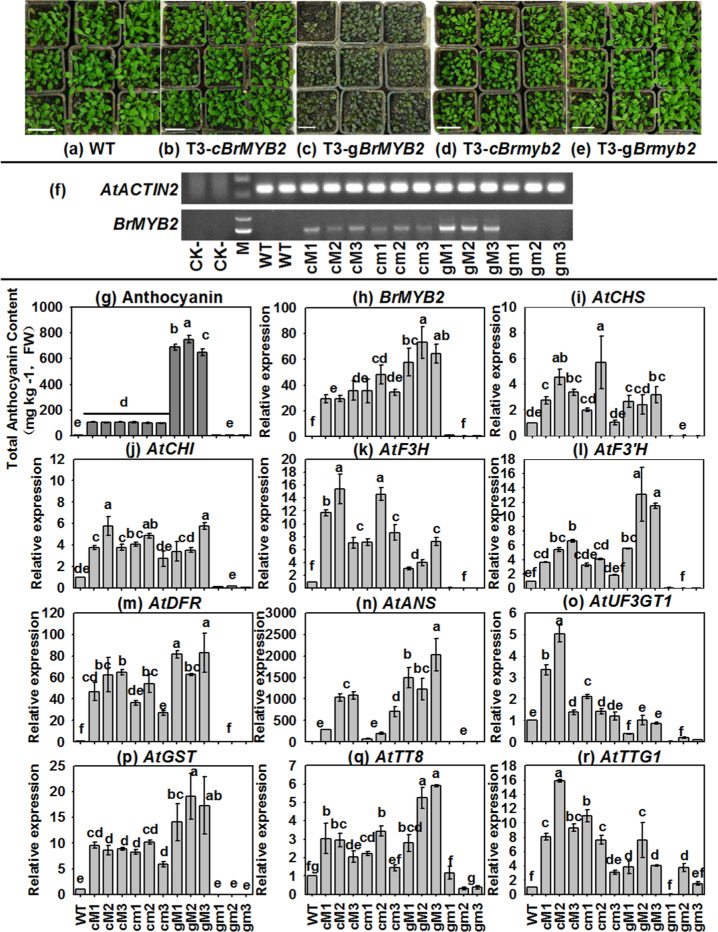
Fig. 8. Total anthocyanin content and expression patterns of related ABGs in different transgenic Arabidopsis lines.
a–e Thirty-day-old Arabidopsis seedlings. a WT Arabidopsis; b T3 CaMV35S:cBrMYB2 lines; c T3 CaMV35S:gBrMYB2 lines; d T3 CaMV35S:cBrmyb2 lines; e T3 CaMV35S:gBrmyb2 lines. f Semi-qRT-PCR analysis of full-length BrMYB2. g Total anthocyanin contents of samples. h qRT-PCR analysis of BrMYB2, and Line 01 of the T3gBrmyb2 lines served as the control. i–r Expression patterns of ABGs in Arabidopsis, and the WT line served as the control. The values are presented as the means ± SDs (n = 3). The different letters above each column are significantly different at p < 0.05 according to Duncan’s test. The first ‘c’ and ‘g’ letters of the abscissa labels represent cDNA and gDNA, respectively; the second letters ‘M’ and ‘m’ represent BrMYB2 and Brmyb2, respectively

