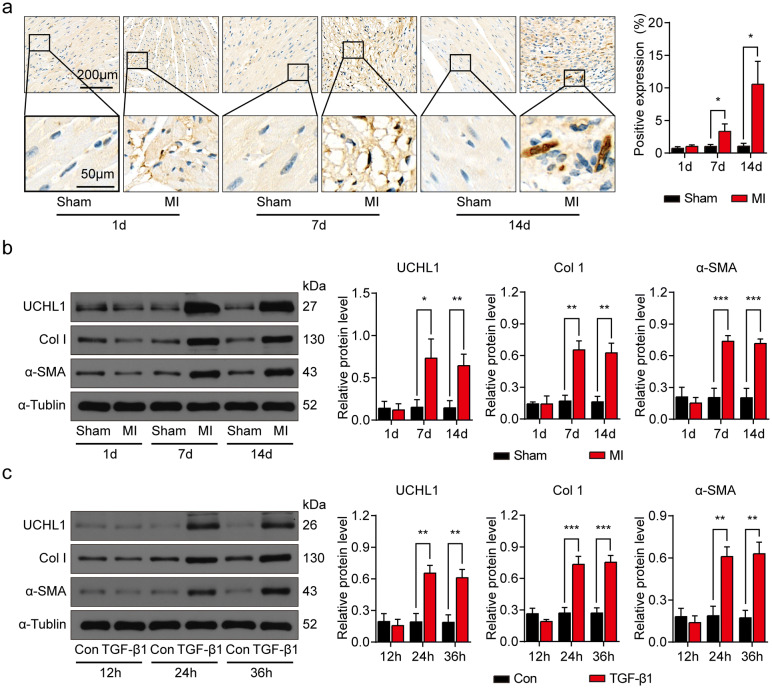
Figure 1.
UCHL1 is upregulated in post MI mouse hearts and CFs treated with TGF-β1. (a) IHC showing the expression of UCHL1 in sham and MI hearts at 1, 7 and 14 days after operation. n = 3, *P < 0.05. Scale bar (upper) = 200 μm. Scale bar (lower) = 50 μm. (b) Western blot and average data showing UCHL1, Col1 and α-SMA protein levels in hearts of sham and MI at 1, 7 and 14 days after operation. n = 3, *P < 0.05, **P < 0.01, ***P < 0.001. (c) Western blot and average data showing UCHL1, Col1 and α-SMA protein levels in CFs treated with and without TGF-β1 for indicated times. n = 3, **P < 0.01, ***P < 0.001.

