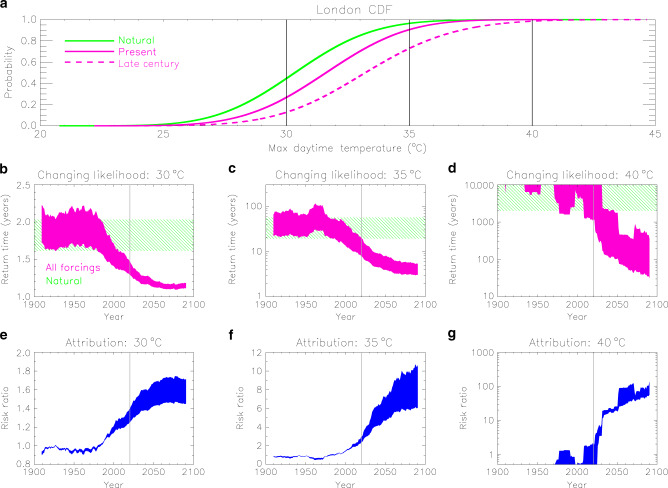
Fig. 6. Increasing chance of high-threshold exceedance illustrated for a location in London.
a Cumulative distribution functions of the local warmest daytime temperature (tx01) for the natural climate (green line), the present-day climate (pink solid line) and the climate of the late twenty-first century (pink dashed line). The 30, 35 and 40 °C thresholds are marked by the vertical black lines. Panels b-d show timeseries of the return time (inverse probability) for the exceedance of the three thresholds with all forcings (in pink). The thickness of the timeseries illustrates the uncertainty in the transfer functions used in the analysis. The expected range in the natural climate is marked in green. Panels e–g show timeseries of the risk ratio (in blue) for the three thresholds, measuring the change in the likelihood of exceeding the threshold relative to the natural climate. The thickness of the timeseries represents the 5–95% uncertainty range. The vertical grey lines in panels b–g mark year 2020 (i.e., the present climate).

