Figure 3.
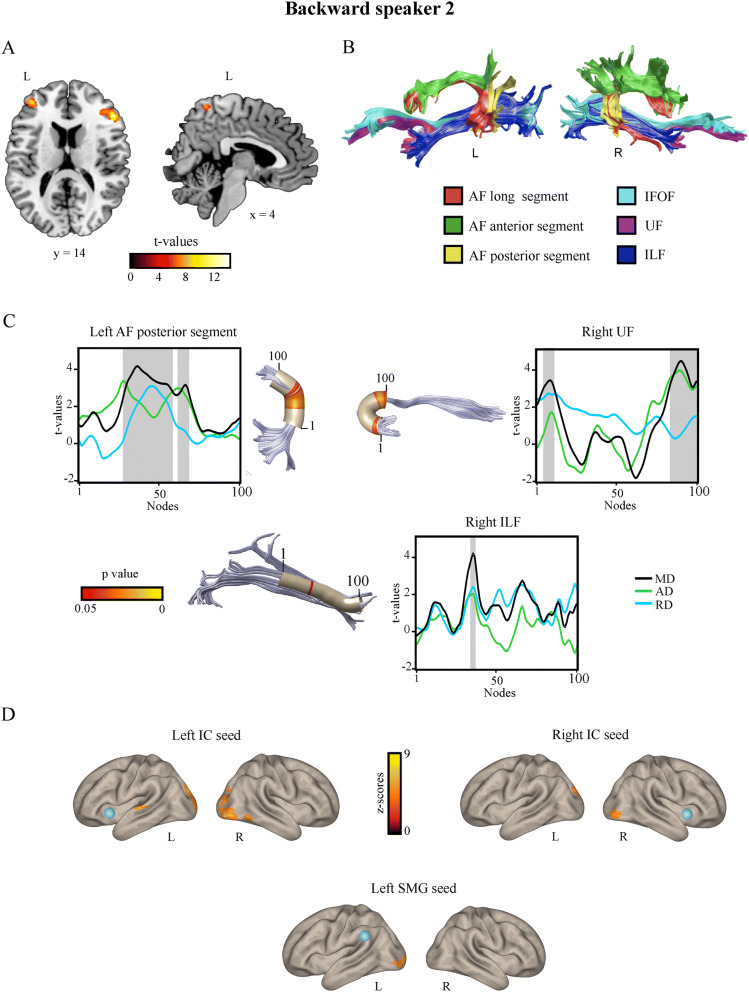
Structural and functional neuroimaging results from Backward speaker 2. (A) Voxel-based morphometry (VBM) results. Relative to controls, Backward speaker 2 showed significantly greater grey matter volume (red-yellow colors) in the left inferior and middle frontal gyri and in the right inferior frontal gyrus. Images are shown in standard space over a MNI template available in MRICRON software. (B) Deterministic tractography reconstruction of the dorsal and ventral language white matter tracts in Backward speaker 2, in the left and right hemispheres, in native space. (C) Tract profiles showing nodes with significant different mean diffusivity (MD) in Backward speaker 2 compared to controls (grey shadowed areas). Since MD represents the mean of the three eigenvectors (λ1 + λ2 + λ3/3), in the significant MD clusters axial diffusivity (AD; λ1), and radial diffusivity (RD, λ2 + λ3/2) indexes were extracted in order to underscore the index driven the change in MD. Note that for the left AF posterior segment, right UF (nodes 5–11) and the ILF both axial diffusivity (AD) and radial diffusivity (RD) are higher, although not significantly, than for controls and, thereby, both indexes seem to contribute to the observed higher MD. For the right UF (nodes 83–100), significantly greater MD is driven by significantly higher AD, while RD shows not significant differences from controls. Nodes are ordered in the dorsal–ventral direction for the AF posterior segment, ventral–dorsal for the UF and posterior–anterior for the ILF. Tracts are shown using a three-dimensional rendering derived from Automated Fiber Quantification (AFQ) software, depicting a core fiber represented as a 5-mm-radius tube (color-coded based on t-values at each node along the tract). (D) Seed-to-voxel functional connectivity results. Orange-yellow color indicates voxels showing increased functional connectivity with the seed in Backward speaker 2 compared to controls. The seeds are indicated for each analysis with a blue sphere. L left, R right, IC insular cortex, SMG supramarginal gyrus, AF arcuate fasciculus, IFOF inferior fronto-occipital fasciculus, UF uncinate fasciculus, ILF inferior longitudinal fasciculus.

