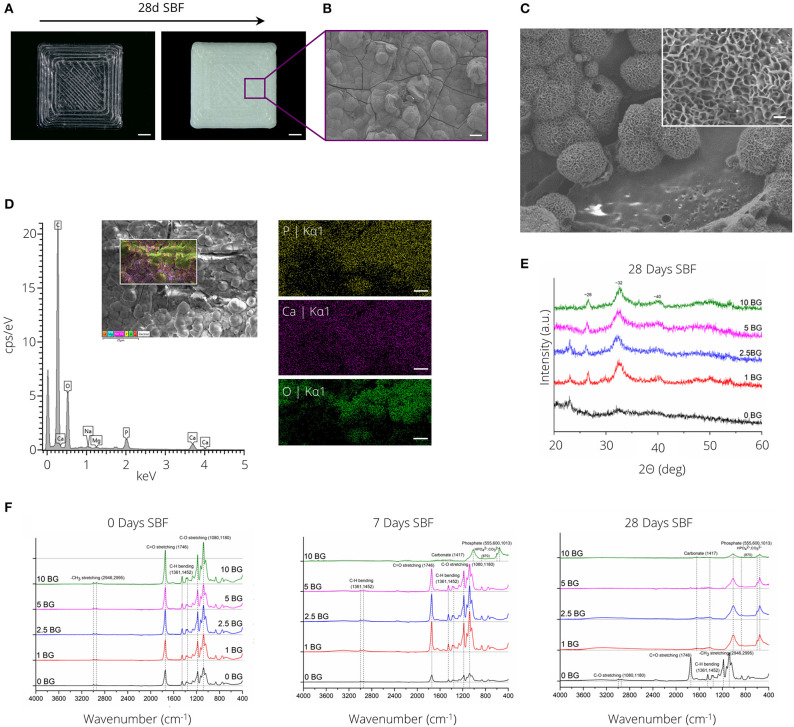
Figure 5.
Bioactivity assessment of PLA-BG materials. (A) Light microscopy images of 3D printed PLA-1% BG squares before (left) and after (right) incubation in simulated body fluid for 28 days. The precipitation of a white layer is apparent on the material surface. Scale bar = 2 mm. (B) SEM micrograph showing the formation of a solid layer with cauliflower-like structures present, indicating the formation of a ceramic hydroxy-carbonated apatite (HCA)-like layer. Scale bar: 20 μm. (C) SEM image of cauliflower like structure on PLA-BG after 14 days of incubation in SBF. Scale bar: 250 nm. (D) Energy dispersive x-ray spectrum of PLA-10% BG scaffolds incubated for 14 days in SBF, indicating the formation of phosphorus, calcium and oxygen species on the formed layer. Scale bar: 5 μm. (E) X-ray diffraction spectrum of the material surfaces of PLA-BG incubated for 28 days in SBF indicating the formation of crystalline species on the surface. (F) Fourier-transformed infrared spectroscopy analysis of PLA-0, 1, 2.5, 5, and 10% (wt) BG squares after 0, 7, and 28 days of incubation in SBF. The formation of new peaks indicative for carbonates and phosphates is shown over SBF incubation time.

