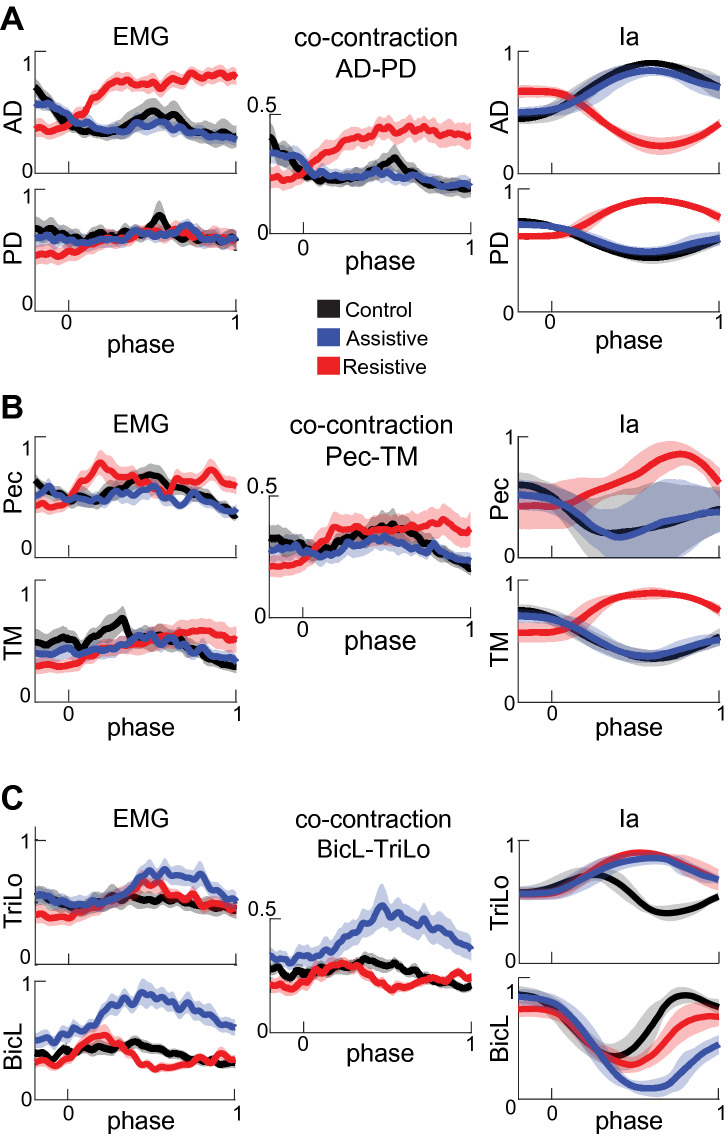
Figure 3.
Normalized EMG, co-contraction, and Ia profiles for muscles spanning the shoulder. Thick lines show averages for each movement across all participants. Shaded areas show the standard error of the mean across participants for EMG and co-contraction signals and standard deviation across participants for Ia signals. Movement phase represents normalized duration of each movement as in Fig. 2. Signals are subdivided into antagonist pairs AD-PD (A), Pec-TM (B), and BicL-TriLo (C).

