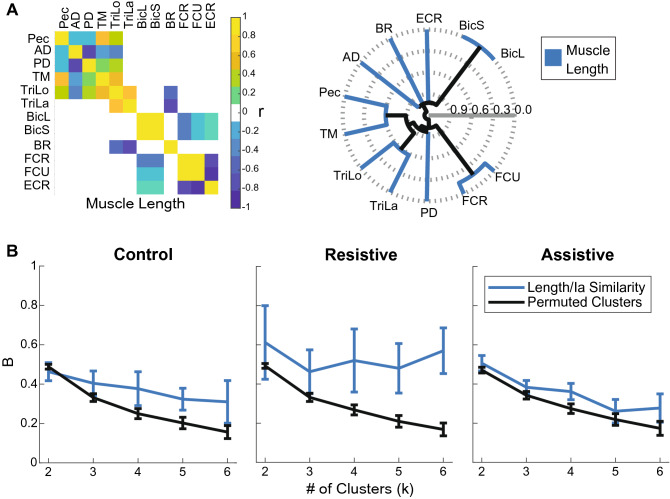
Figure 6.
Comparison between muscle length and Ia clustering. (A) The relationships between muscle length profiles per task in a default “average subject” model used in1. The plots are formatted as in Fig. 5. (B) Fowkles–Mallow Index (B) for the comparison between muscle length and Ia cluster assignments (blue) and for the comparison between muscle length and permuted Ia cluster assignments representing random match (black) at different cluster subdivisions. Error bars show pooled standard deviation across participants.

