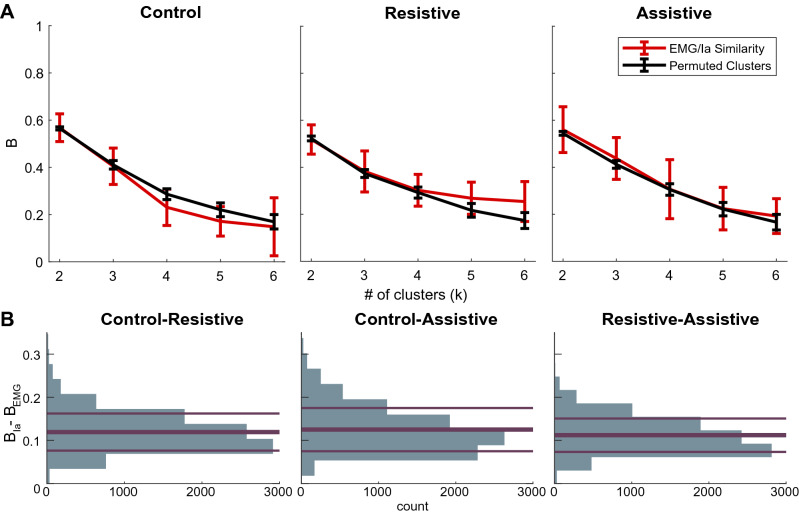
Figure 7.
The consistency of hierarchical clustering between EMG and Ia within and across movements. (A) Fowkles–Mallow Index (B) for the comparison between EMG and Ia cluster assignments (red) and for the comparison between EMG and permuted Ia cluster assignments representing random match (black) at different cluster subdivisions. Error bars show pooled standard deviation across participants. (B) Histograms of the differences in BIa and BEMG between tasks across bootstrapped hierarchal cluster trees. The abscissa indicates no difference in B values between tasks; the thick line is at the mean of the distribution; thin lines show standard deviations of the distributions.

