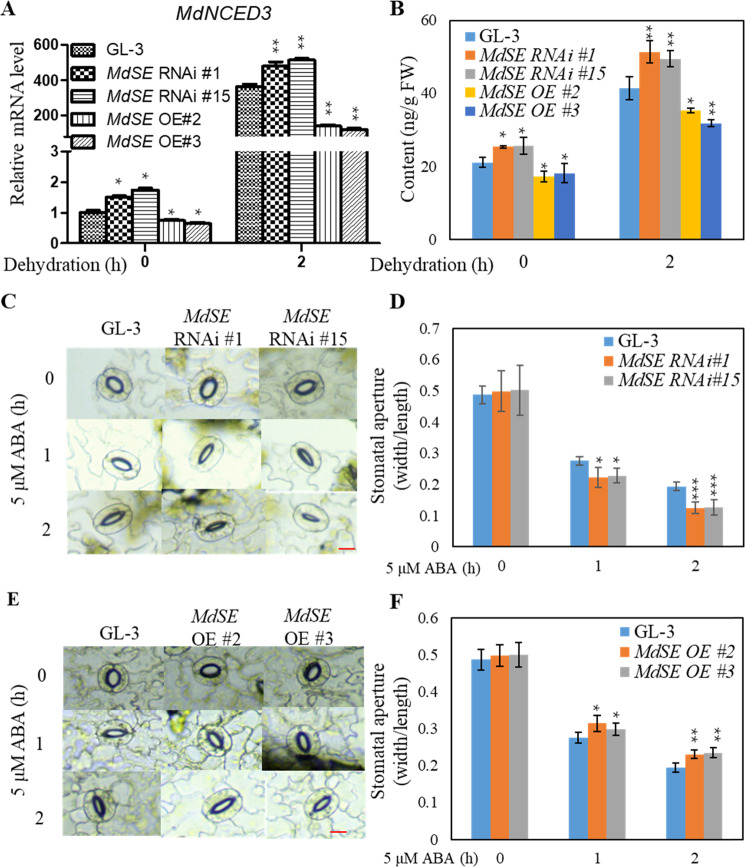
Fig. 4. ABA response and content in MdSE RNAi and MdSE OE plants.
a Expression of MdNCED3 in GL-3, MdSE RNAi, or MdSE OE plants under control or dehydration conditions. Error bars indicate standard deviation (n = 3). Student’s t test was performed, and statistically significant differences are indicated by *P < 0.05 or **P < 0.01. b The ABA content in GL-3, MdSE RNAi, or MdSE OE plants under control or dehydration conditions. Error bars indicate standard deviation (n = 5). c, e Representative images of stomata of GL-3 and MdSE transgenic plants in response to ABA treatment. Bars = 10 μm. d, f Stomatal aperture of GL-3 and MdSE transgenic plants under ABA treatment. Data are the means ± SD; 5 leaves were used, and at least 80 stomatal apertures were measured for each treatment. Student’s t test was performed, and statistically significant differences are indicated by *P < 0.05, **P < 0.01, or ***P < 0.001

