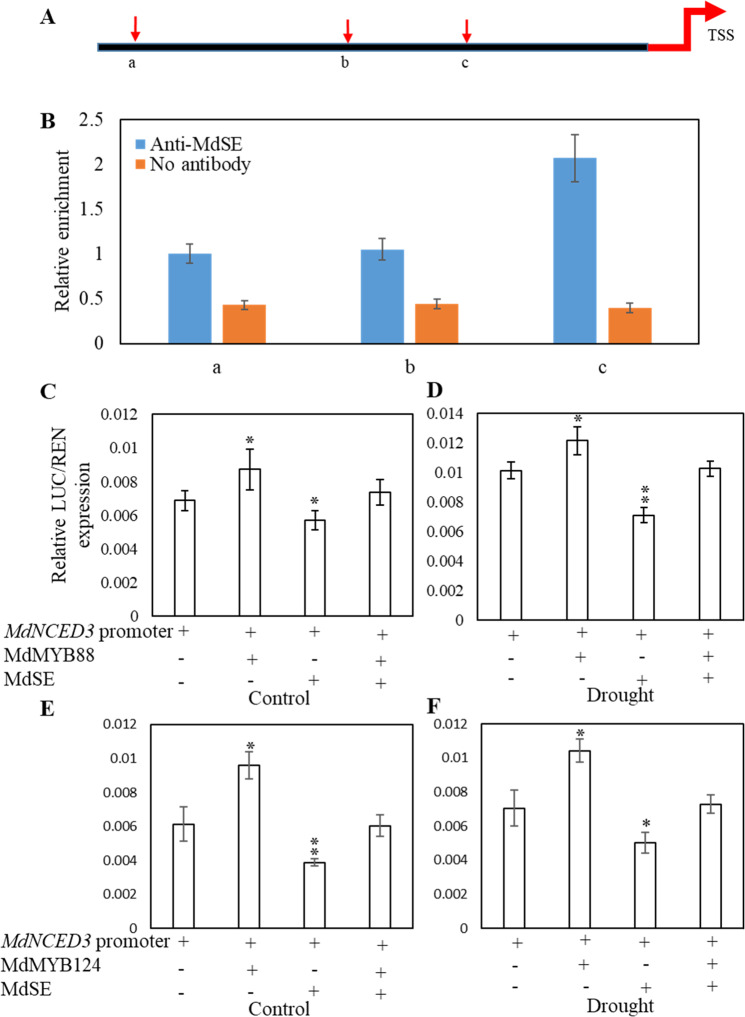
Fig. 5. MdSE is enriched in the MdNCED3 promoter and decreases MdNCED3 activity.
a Diagram of MdNCED3 promoter regions. a–c Represent fragments containing two cis-elements of AGCCG from −1830 to −1826 bp, −1368 to −1364 bp and one cis-element of CGCGG from −880 to −876 bp, respectively. For the negative control, no antibody was added. TSS transcription start site. b MdSE enrichment in the MdNCED3 promoter determined by ChIP-qPCR analysis. c–f Relative luciferase activity from dual luciferase reporter assays in N. benthamiana leaves. Pro35S::REN was used as an internal control. Quantification was performed by normalizing firefly luciferase activity to that of Renilla luciferase. Leaves of N. benthamiana were coinfiltrated and grown for 72 h, and then leaves were collected or dehydrated for an additional 2 h. Error bars indicate standard deviation (n = 10). Student’s t test was performed, and statistically significant differences are indicated by *P < 0.05 or **P < 0.01

