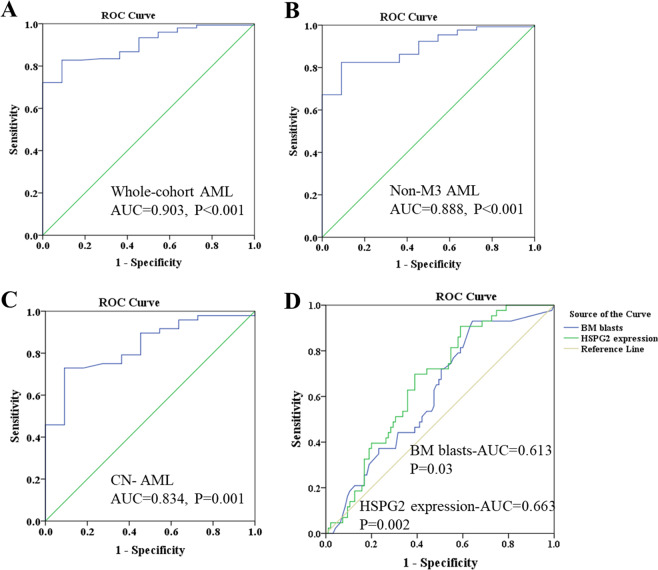
Fig. 3. ROC curve analysis of HSPG2 expression for discriminating acute myeloid leukemia patients from controls.
a in whole‐cohort AML. b in non‐M3 AML. c in CN‐AML. d The ROC curves of BM blasts and HSPG2 expression for predicting death within 2 years in whole-cohort AML. AML acute myeloid leukemia, AUC area under the ROC curve, Non-M3 AML non M3 acute myeloid leukemia, CN-AML cytogenetically normal acute myeloid leukemia, BM bone marrow.

