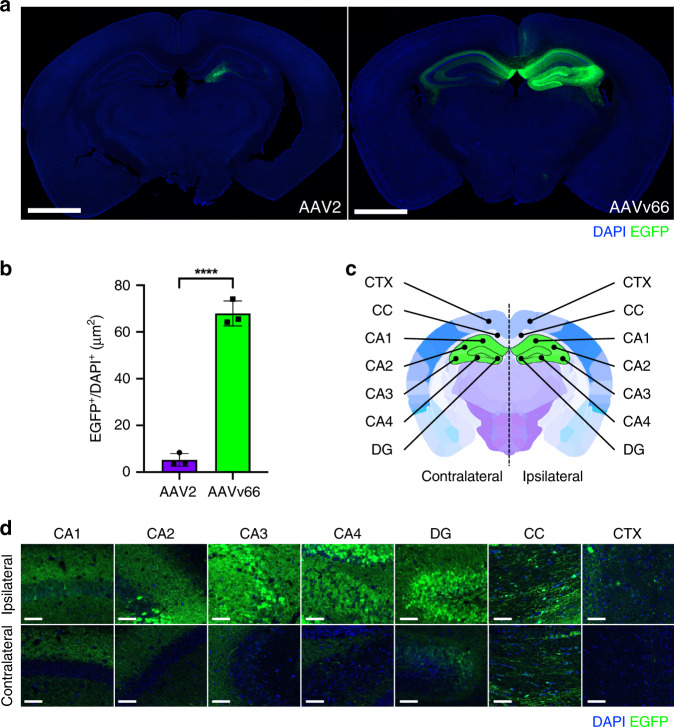
Fig. 2. Transduction spread of rAAV2 and rAAVv66 following intrahippocampal injection.
a Representative native EGFP (green) expression following rAAV2-CB6-PI-EGFP or rAAVv66-CB6-PI-EGFP injection via unilateral intrahippocampal administration. Scale bars = 700 μm. b Quantification of EGFP-positive surface normalized to DAPI-positive surface from panel a data. Data are presented as the mean ± SD; n = 3 animals/group from one experiment. ****P < 0.0001, two-tailed Student’s t test. c Coronal brain schematic depicting sub-anatomical regions of interest in both contralateral and ipsilateral hemispheres (adapted from Allen Mouse Brain Atlas). Cornu ammonis (CA1–CA4), dentate gyrus (DG), corpus callosum (CC), and cortex (CTX). d Representative high-magnification images of rAAVv66 transduced sub-anatomical regions from n = 3 animals from one experiment. Scale bars = 50 μm.

