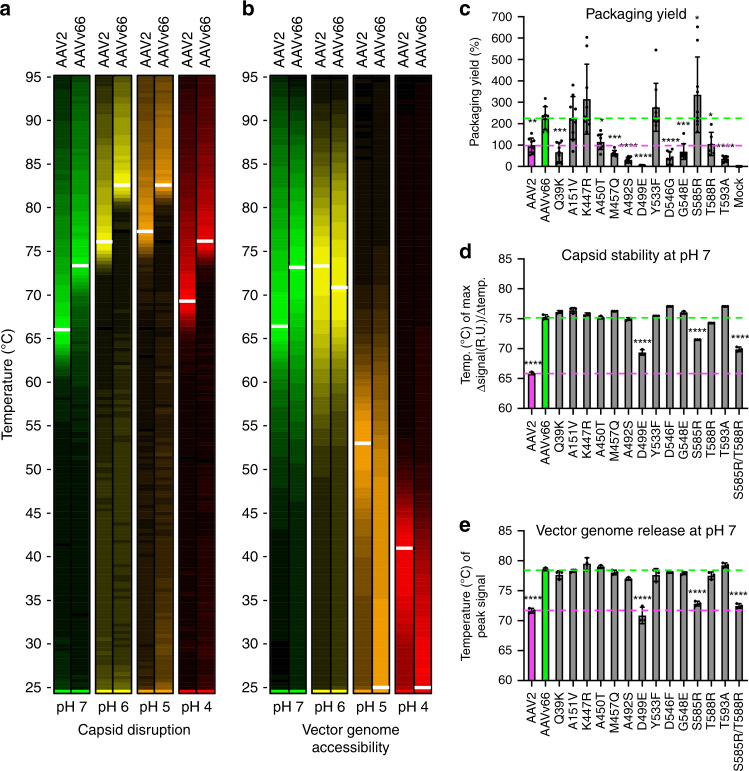
Fig. 4. Biophysical analyses of AAVv66.
a, b Heatmap displays of differential scanning fluorimetry (DSF) analyses to query (a) capsid protein unfolding (uncoating) and (b) DNA accessibility (vector genome extrusion) at pHs 7, 6, 5, and 4. Color scaling depicted represent relative peak signals from highest to lowest value (brightest to dimmest, respectively). c–e Each defining amino acid residue of AAVv66 was converted to those of AAV2 by site-directed mutagenesis and examined for changes in c packaging yield, d capsid stability, and e genome release at pH 7. Values represent mean ± SD. p Values were determined by one-way ANOVA. *p < 0.05, **p < 0.01, ***p < 0.001, ****p < 0.0001. n = 3/group.

