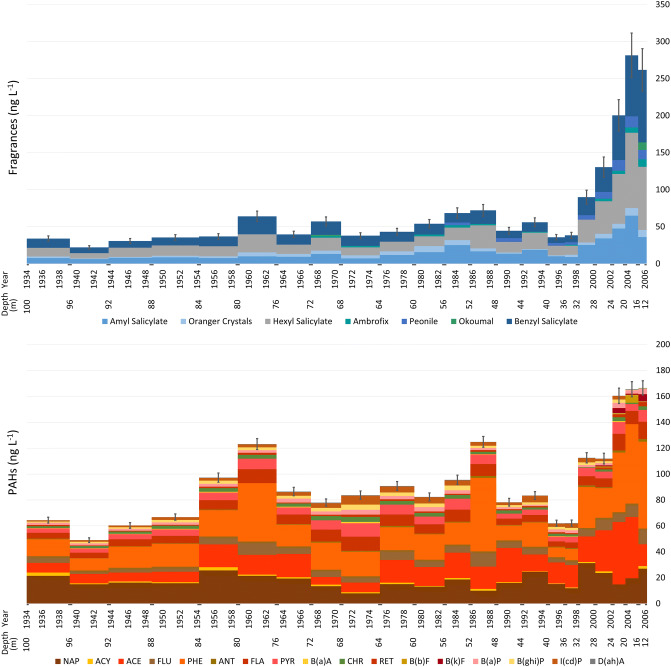
Figure 2.
Fragrances and PAHs (ng L−1) in the Elbrus ice core with the year of snow deposition (CE) and the sample depth (m) reported along the abscissas. Error bars correspond to the standard deviation percentage of the method precision. Seasonal dating uncertainties of the analyzed ice core sections (0.5 years) are shown below the x-axes. Only detected compounds are displayed. Note the different y-axis scales for the fragrances and PAHs.

