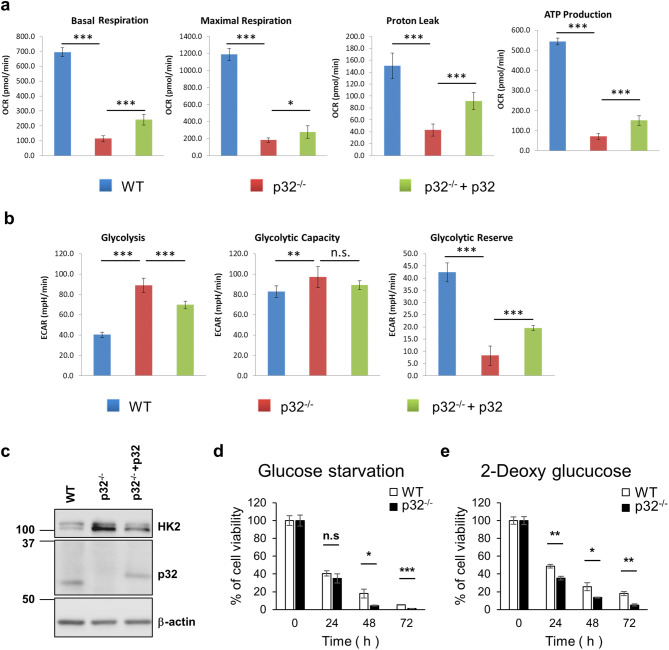
Figure 7.
The metabolic shift from OXPHOS to glycolysis was induced by genetic ablation of p32/C1QBP resulting in glucose addiction. (a) Wild type, p32−/− and p32−/− + p32 MEFs were subjected to Agilent Seahorse XF Cell Mito Stress Test to measure basal respiration, maximal respiration, proton leak and mitochondrial ATP production. Bar graphs illustrate the absolute value of OCR that was calculated from SI Fig S8a,b and plotted with SD as error bars. Student’s t test, *p < 0.05, ***p < 0.001. (b) Wild type, p32−/− and p32−/−+p32 MEFs were subjected to Agilent Seahorse XF glycolysis stress test to measure glycolysis, glycolytic capacity and glycolytic reserve. Bar graphs illustrate the absolute value of ECAR that was calculated from SI Fig S8c,d and plotted with SD as error bars. Student’s t test, **p < 0.01, ***p < 0.001, n.s. non-significant. (c) Wild type and p32−/− MEFs were transfected with pcDNA or a p32 expression vector as indicated and subjected to Western analysis for hexokinase 2 (HK2), p32 and β-actin. (d) Wild type and p32−/− MEFs were incubated in complete glucose-free medium for the indicated time and subjected to MTT assay. % of cell viability shown with SD as error bars. Student’s t test, *p < 0.05, ***p < 0.001, n.s. non-significant. (e) Wild type and p32−/− MEFs were treated with 5 mM 2-deoxy-d-glucose for the indicated time and subjected to MTT assay. % of cell viability shown with SD as error bars. Student’s t test, *p < 0.05, ***p < 0.001, n.s. non-significant.

