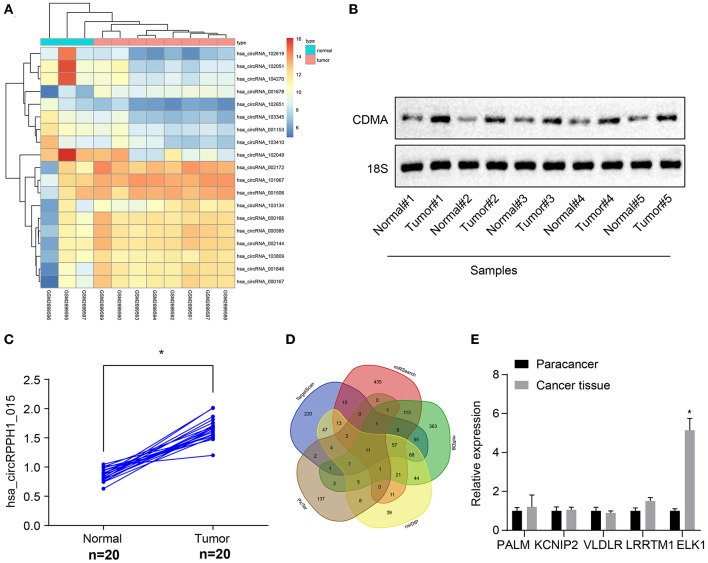
Figure 1.
Bioinformatics revealed a possible regulatory mechanism involving hsa_circRPPH1_015, miR-326, and ELK1 in BC. (A) The heat map of the microarray GSE110123. (B) Representative image of the northern blot analyses of hsa_circRPPH1_015 expression performed using five tumor tissues and adjacent normal tissues (N = 5). (C) Quantification of northern blot analyses of hsa_circRPPH1_015 expression performed in 20 tumor tissues and adjacent normal tissues (N = 20). (D) Prediction of the target genes of miR-326 using MirDIP database, TargetScan database, miRSearch database, miRDB database, and PicTar database. (E) The expression of PALM, KCNIP2, VLDLR, LRRTM1, and ELK1 obtained from the GSE35412 dataset determined by RT-qPCR. *p < 0.05 vs. normal or adjacent normal tissues. The above data were all measurement data and expressed as mean ± standard deviation, and the paired t-test was used for comparison between cancer tissues and adjacent normal tissues. Values were obtained from three independent experiments. BC, breast cancer; ELK1, ETS-domain containing protein; KCNIP2, Kv (potassium) channel interacting protein 2; VLDLR, very low-density lipoprotein receptor; LRRTM1, leucine rich repeat transmembrane neuronal 1; RT-qPCR, reverse transcription quantitative polymerase chain reaction.

