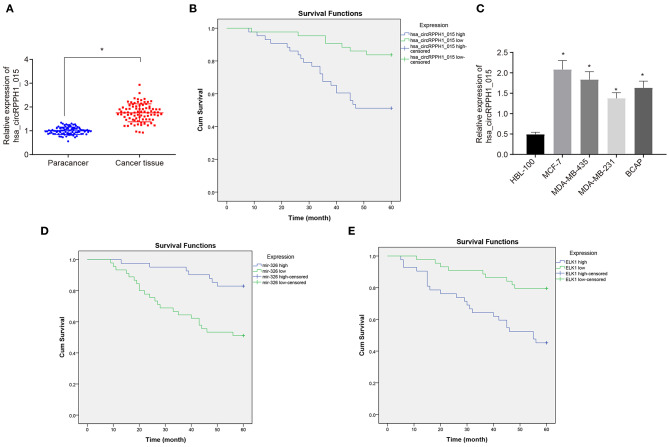
Figure 2.
The expression of hsa_circRPPH1_015 was associated with the progression of BC. (A) Hsa_circRPPH1_015 expression in BC tissues and adjacent normal tissues determined by RT-qPCR. (B) The correlation analysis between hsa_circRPPH1_015 expression and prognosis of patients with BC by Kaplan–Meier survival analysis. (C) The expression of hsa_circRPPH1_015 in normal breast cell lines and BC cell lines determined by TaqMan-PCR assay. (D) Corelation analysis of prognosis and survival in patients with high and low expression of miR-326 by Kaplan–Meier survival analysis. (E) Corelation analysis of prognosis and survival in patients with high and low expression of ELK1 by Kaplan–Meier survival analysis. *p < 0.05 vs. the adjacent normal tissues or HBL-100 cell line. The quantitative analysis results were measurement data and compared by paired t-test between two groups and by one-way ANOVA among multiple groups. Values were obtained from three independent experiments. BC, breast cancer; ELK1, ETS-domain containing protein; RT-qPCR, reverse transcription quantitative polymerase chain reaction; ANOVA, analysis of variance.

