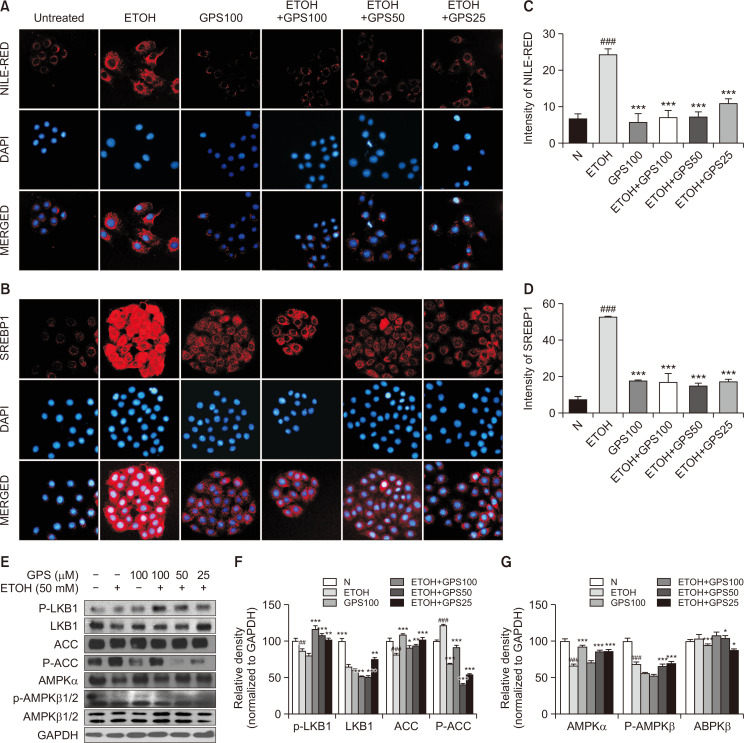
Fig. 3.
GPS inhibited lipid accumulation in ethanol-treated steatotic AML-12 cells. (A) Nile-red staining. Nile red (red, intracellular lipid droplets), DAPI (blue, nucleus). (B) Immunofluorescence staining of SREBP1 (SREBP1, red; DAPI, blue). Relative fluorescence intensity of Nile red (C) and SREBP1 (D) was analyzed with Image Pro-Plus 6.0 software (Media Cybernetics, Inc.). (E) P-LKB1, LKB1, ACC, P-ACC, AMPKα, AMPKβ and P-AMPKβ proteins levels were detected by western blotting. GAPDH was used as a loading control. (F, G) Densitometric tracing analysis was done for each western blot band normalized to GAPDH. ##p<0.01, ###p<0.001, significantly different from untreated cells; *p<0.05, **p<0.01, ***p<0.001 significantly different from ethanol-stimulated cells. Representative images are shown. All histograms represent the mean ± SD of at least three independent assays.

