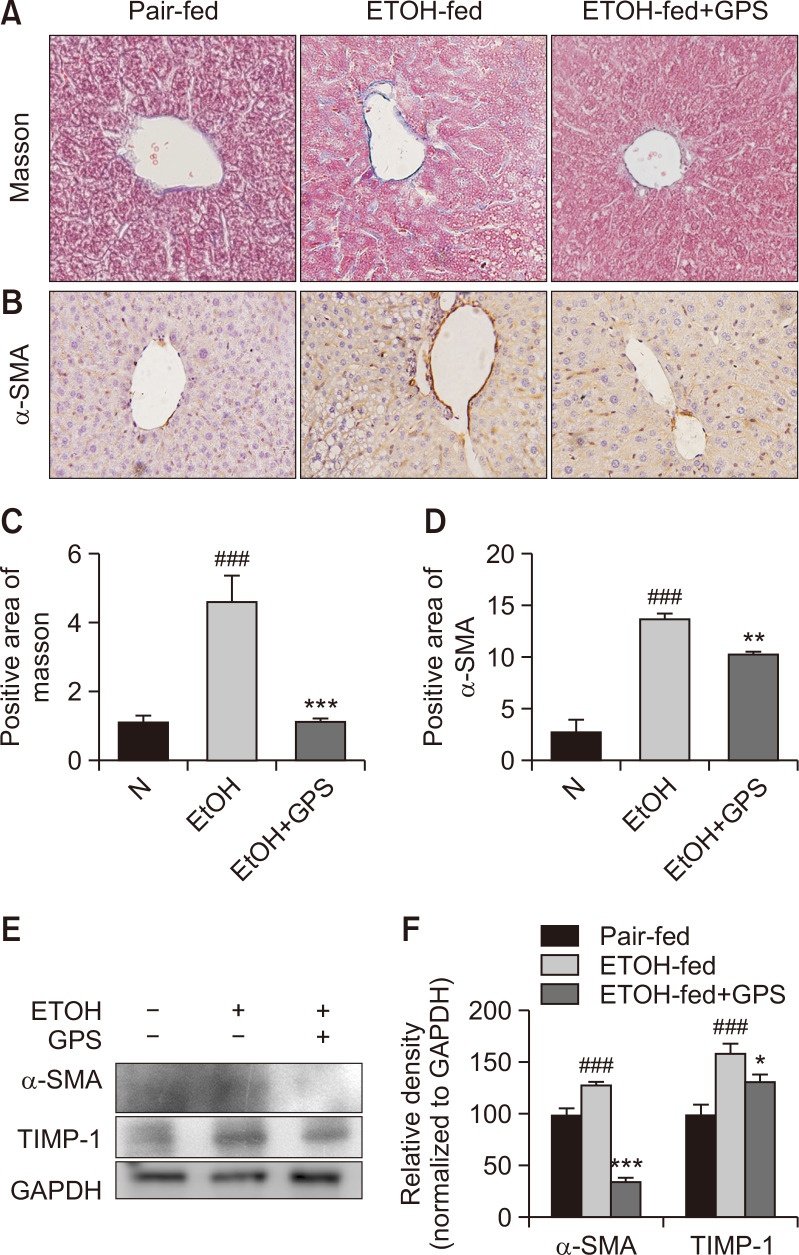
Fig. 4.
GPS reversed ECM deposition in chronic alcohol intake-induced liver fibrosis (A) Masson’s trichrome staining. (B) Immunohistochemical analysis of α-SMA. Representative images were captured with 200× magnification. The averaged percentages of positive staining areas for Masson (C) and α-SMA (D) were analyzed with Image Pro-Plus 6.0 software (Media Cybernetics, Inc.). (E) Western blot analysis of α-SMA, TIMP-1 and GAPDH (loading control). (F) Densitometric tracing analysis was done for each western blot band normalized to GAPDH. Data represent the mean ± SD of three independent experiment. ###p<0.001, significantly different from the pair-fed group; *p<0.05, **p<0.01, ***p<0.001, significantly different from the ethanol-fed group. Representative images are shown. All histograms represent the mean ± SD of at least three independent assays.

