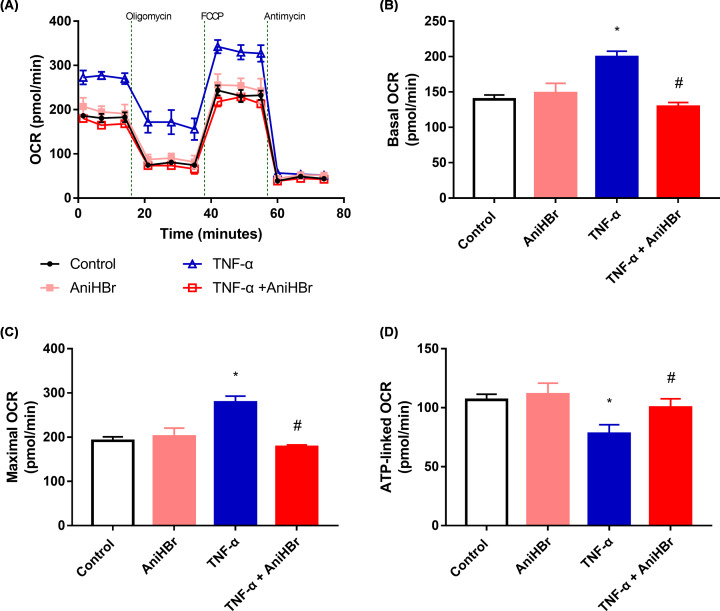
Figure 6. AniHBr rescued TNF-α inhibited metabolic switch.
Cells were treated with or without a final concentration of 10 μg/ml AniHBr in the presence of a final concentration of 10 ng/ml TNF-α for 24 h. Then, the mito stress test was performed. (A) Oxygen consumption rate (OCR) curves. (B) Basal OCR. (C) Maximal OCR. (D) ATP-linked OCR. n=3, Mean ± SD, *P<0.05 vs. control; #P<0.05 vs. TNF-α.

