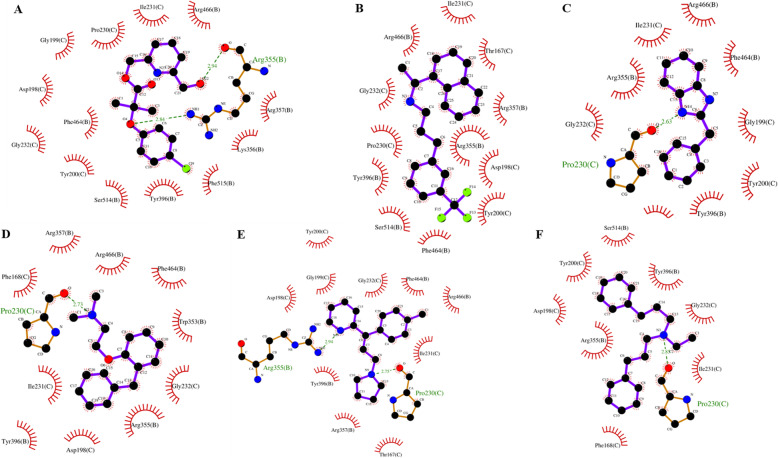
Fig. 6.
Selected Ligplot [15] diagrams from the fifteen poses in Fig. 5 (using Ledock poses). These figures indicate the interactions between the drug (the ligand, displayed in ball and stick format) and the surrounding pocket residues. Hydrogen bonds are indicated by a dashed line between the drug ligand atom and the atom of the residue lining the pocket which is also displayed in ball and stick in these instances. Van der Waals contacts are indicated by “fans” of lines around each residue directed towards the drug which also have reciprocal fans directed towards each of the residues lining the pocket with which it is interacting. The plots are for the drugs: a. Pirifibrate b. Cinacalcet c. Bendazol d. Phenyltoloxamine e. Triprolidine f. Alverine

