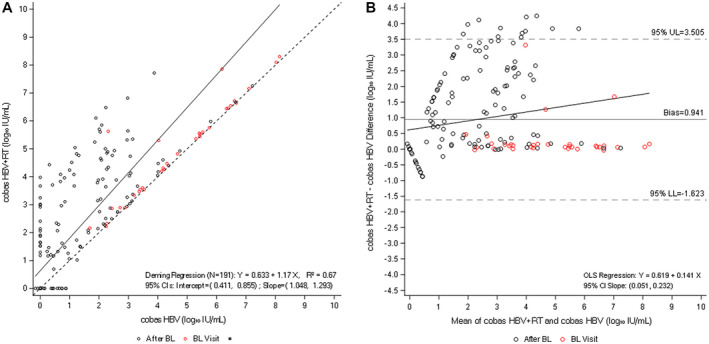
FIG. 1.

Comparison of cobas HBV and cobas HBV+RT (Hannover cohort). (A) Deming regression analysis of viral load quantification for cobas HBV versus cobas HBV+RT. (B) Bland−Altman bias plot for measurement of HBV with both tests. Abbreviations: BL: Baseline; CI, confidence interval; LL, lower limit; OLS, ordinary least squares; UL, upper limit.
