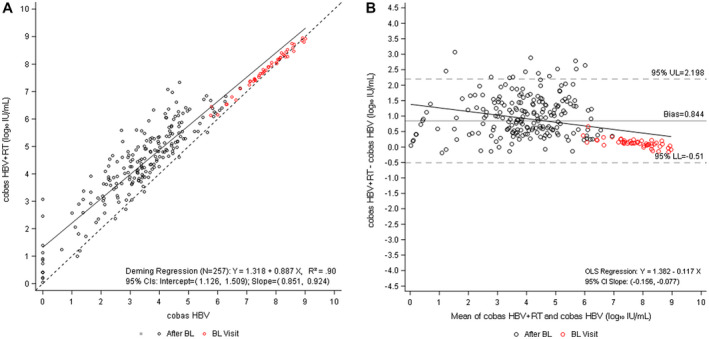
FIG. 2.

Comparison of cobas HBV and cobas HBV+RT (DEFINE cohort). (A) Deming regression analysis of viral load quantification for cobas HBV versus cobas HBV+RT. (B) Bland−Altman bias plot for measurement of HBV with both tests. Of the 346 longitudinal observations available from seven selected time points (day 1, weeks 12, 24, 48, 72, 84, and 96), 257 samples with enough remaining volume generated valid results for both tests and are included in these plots.
