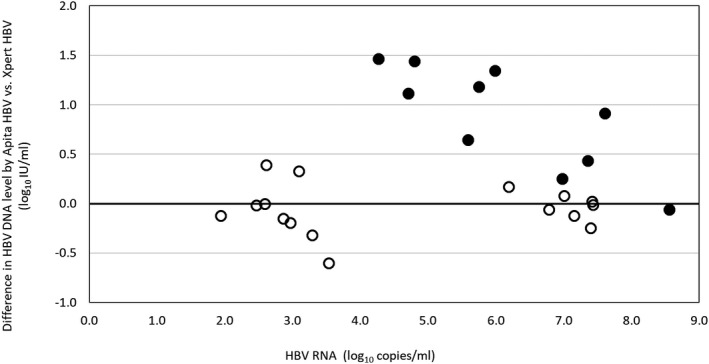
FIG. 6.

Difference in HBV‐DNA levels quantified by TMA (Aptima HBV) and real‐time PCR (Xpert HBV). Each dot indicates a single patient (n = 26). The solid dots indicate patients who were receiving antiviral therapy at the time of sampling (n = 10), whose characteristics are detailed in Table 6.
