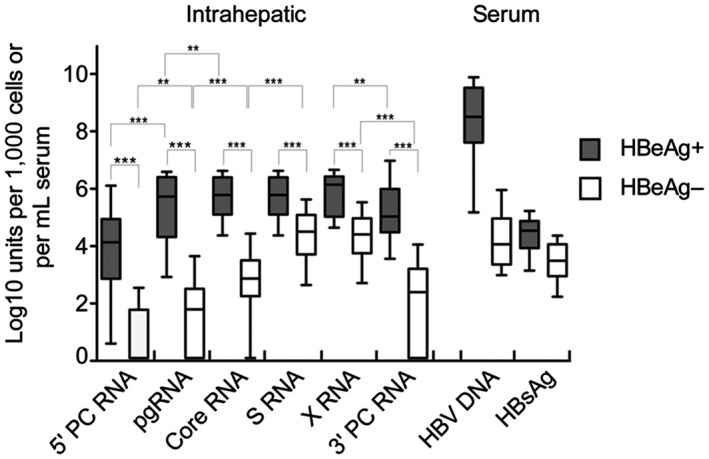
Fig. 2.

Intrahepatic HBV RNA profiles in patients positive or negative for HBeAg. The box plots shows median levels and interquartile ranges that were observed by ddPCR assays targeting different segments of the genome. The levels of HBsAg and HBV DNA in serum are shown for comparison. Whiskers show tenth and ninetieth percentile; ***P < 0.0001; **P < 0.001. Abbreviation: PC, precore.
