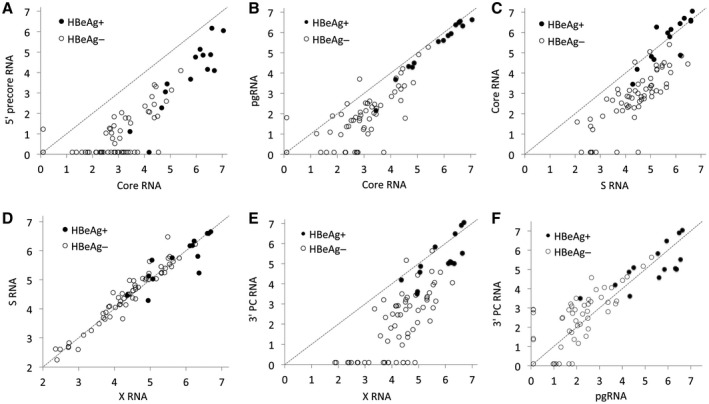
Fig. 3.

Correlations between levels of intrahepatic HBV RNA measured by ddPCR. (A) The 5′ precore RNA levels were ≈1.6 log10 units lower than core RNA. (B) pgRNA was almost 1 log10 unit lower than core RNA in patients who were HBeAg negative. (C) Core RNA levels were ≈1.6 log10 units lower than S RNA in patients who were HBeAg negative. (D) RNA levels measured in S and X regions were similar. (E) RNA levels measured in the 3′ precore (redundancy) region were much lower than RNA levels measured in the X region a short distance upstream, indicating that a large proportion of the RNA in patients who were HBeAg negative lacked the 3′ redundancy part (nt 1830‐1927), either because they were derived from integrated HBV DNA or because they were truncated by the use of an upstream polyadenylation signal. (F) Levels obtained by ddPCR targeting pgRNA and 3′ precore (redundancy) regions. The unit in all plots is log10 copies/1,000 cells. Undetected RNA is shown as 0.1 log10 units/1,000 cells. The dotted line shows y = x. Abbreviation: PC, precore.
