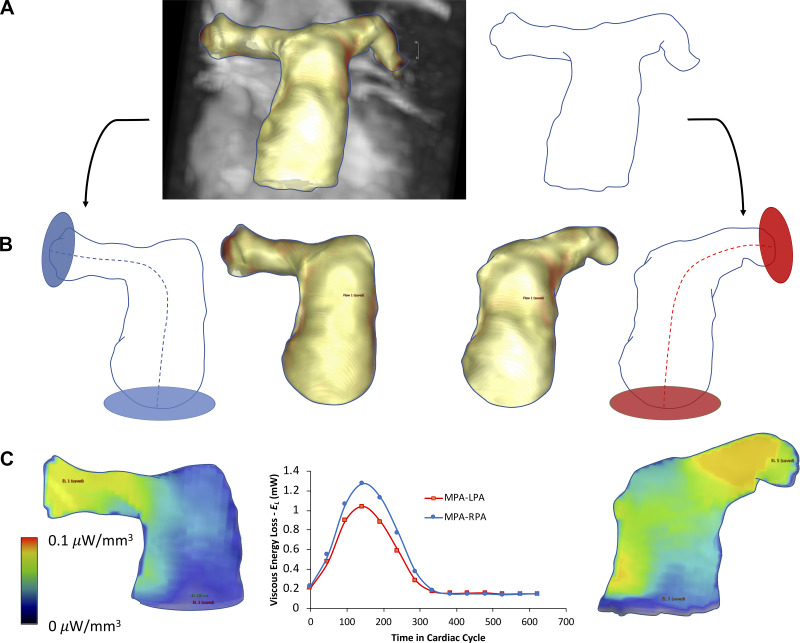
Fig. 2.
Viscous energy loss (EL) analysis scheme in pulmonary vasculature. A: from the segmented 3-dimentional contour depicting the proximal pulmonary vasculature, EL was calculated along 2 standardized anatomic trajectories. B: the first trajectory, main pulmonary artery (MPA)-right pulmonary artery (RPA), was defined by the centerline placement from the pulmonary valve 5 cm from the center of the bifurcation. Identical approach was applied for the MPA-left pulmonary artery (LPA) trajectory. C: mean intensity projection of the EL field within each trajectory, with the EL waveform depicting the amount of the viscous energy loss at various time through cardiac cycle.

