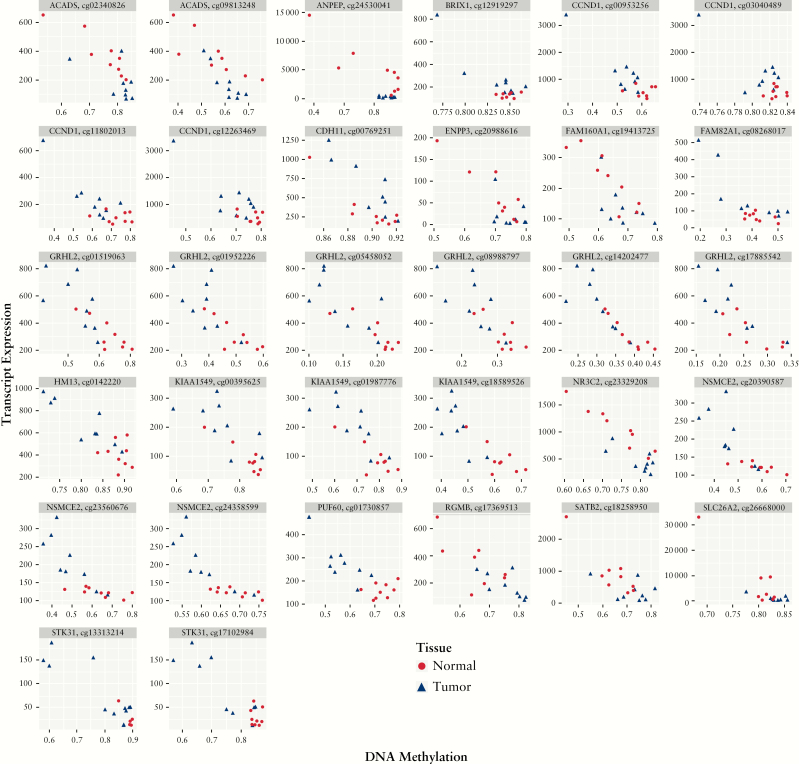
Figure 3.
Genes with an inverse relationship between DNA methylation and RNA transcript expression in patients with ulcerative colitis. Correlation plots demonstrating transcript expression on the y-axis and normalised DNA methylation values for 32 loci encompassing 18 genes on the x-axis which had a significant difference in transcript expression between UC cancer and adjacent tissue [adjusted p-value <0.05] as well as a statistically significant negative correlation between methylation and expression [Pearson’s p-value <0.05]. Blue triangles represent tissue from UC-associated colon cancers and red circles represent tissue from adjacent non-dysplastic mucosa. UC, ulcerative colitis.

