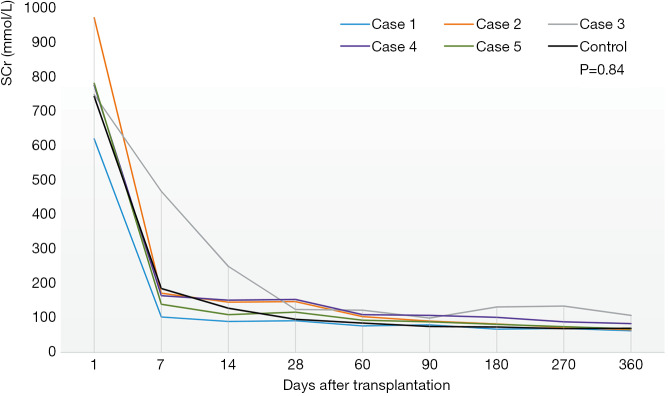
Figure 1.
The change of serum creatinine (SCr) after transplantation in two groups. Figure 1 shows the changes of SCr after transplantation in two groups. The levels of SCr were recorded for all recipients 1, 7, 14, 28, 60, 90, 180 and 360 days after transplantation. The post-operative SCr in group A was listed respectively (case 1–5). The post-operative SCr in group B was expressed by the average SCr of four recipients because the other one (control 4) was a five-year-old child whose renal function recovered obviously better than others and SCr was much lower. There was no significant difference in serum creatinine between two groups (group A vs. group B, 191.24±211.64 vs. 169.94±205.82 µmol/L, P=0.84).

