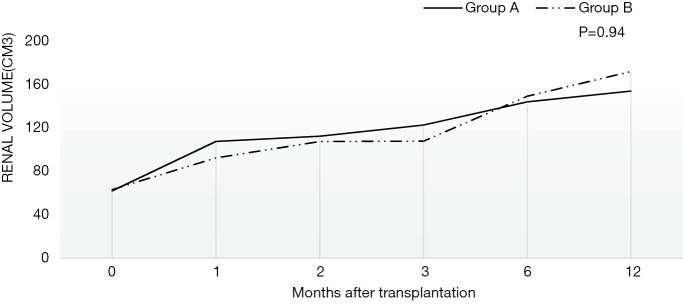
Figure 2.
The change of graft size after transplantation in two groups. Figure 2 shows the change of graft size after transplantation in two groups. The graft size was recorded for all recipients at the transplantation and 1, 2, 3, 6, 12 months after transplantation. The two curves were the average graft size of two groups respectively. There was no significant difference in graft size between two groups (group A vs. group B 117.11±29.64 vs. 115.49±35.84 cm3, P=0.94).

