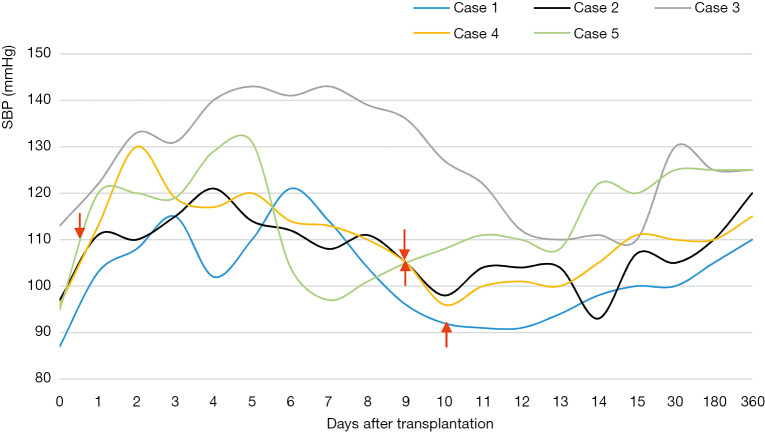
Figure 3.
The change of SBP in group A after transplantation. Figure 3 shows the changes of systolic blood pressure (SBP) in group A after transplantation. The fluctuation of SBP tends to be narrower. The red arrows represent the time to stop intravenous vasopressors. The stop time was 10, 9 and 9 days after transplantation for case 1, 2 and 4 respectively. For case 5, she stopped 14 hours after surgery. Case 3 didn’t receive any vasopressor.

