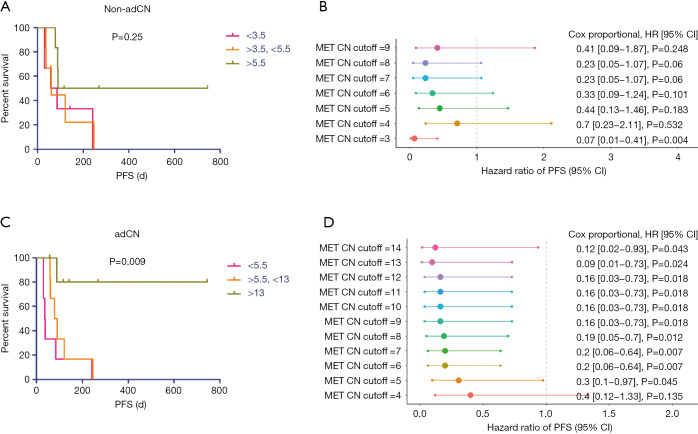
Figure 3.
Kaplan-Meier analysis of progression-free survival of the 18 MET TKI-treated NSCLC patients based on the non-adjusted (A,B) and adjusted (C,D) MET copy numbers classified according to abundance. (A,C) Progression-free survival curve. Pink bars indicate low copy number, orange bars refer to intermediate copy number, and green bars represent high copy number. X-axis denotes survival time in days starting from the first day of treatment. Y-axis denotes the percentage of patient survival. Tick marks indicate survival of patients whose disease had not progressed at last follow-up. (B,D) Forest plot demonstrating the corresponding Cox proportional HR, 95% CI, and P value of each MET copy number cut-off. X-axis denotes the hazard ratio of PFS at 95% CI. Y-axis denotes different MET copy number cut-off. non-adCN, non-adjusted copy number; adCN, adjusted copy number; MET, mesenchymal-epithelial transition factor; TKI, tyrosine kinase inhibitor; NSCLC, non-small cell lung cancer; HR, hazard ratio; CI, confidence interval.

