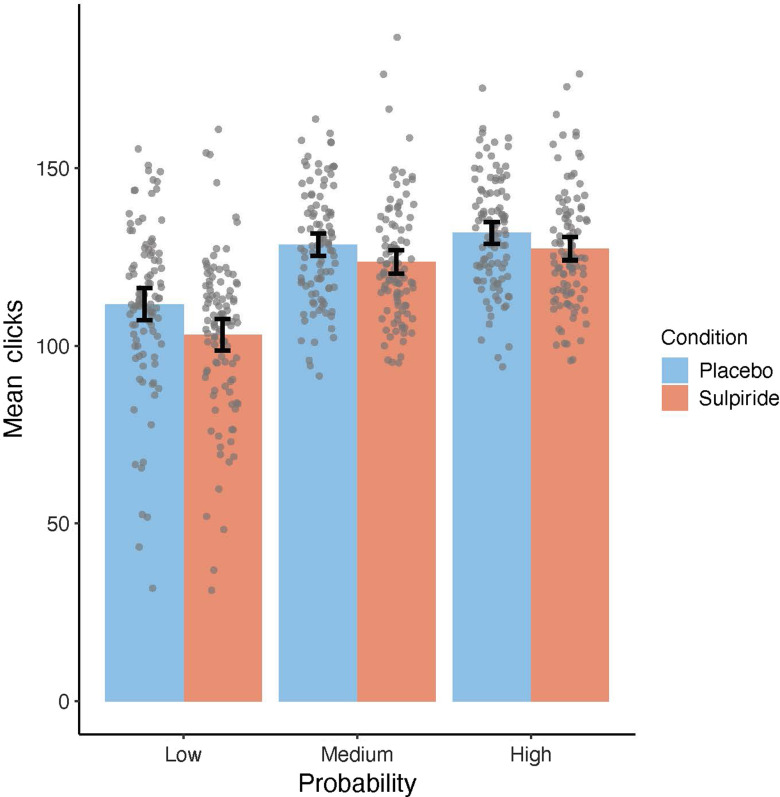
Figure 2.
Mean number of clicks adjusted for participants’ motoric abilities, comparing trials with low probability of reward attainment (left), medium probability of reward attainment (middle), and high probability of reward attainment (right) as compared between both substance groups (sulpiride groups is shown in red and placebo group is shown in blue). Data points are added as dots for individual scores. Error bars depict a 95% confidence interval (CI) of the mean.

