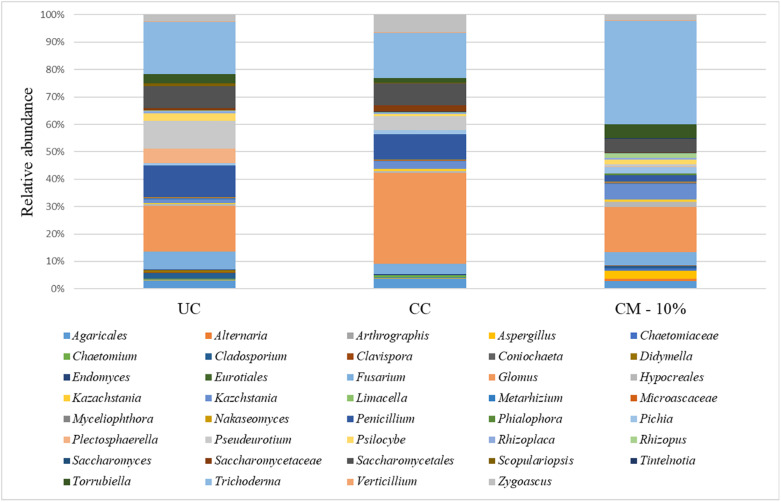
FIGURE 4.
Relative abundance of the mycobiota in the rhizosphere samples at the end of the trials: untreated control (UC), chemical control (CC), and CM – 10% treatment. Three biological replicates were collected from three different pots per treatment and for each trial. Only OTUs which showed an incidence above 0.2% in at least two samples are shown. The data from replicates were averaged.

