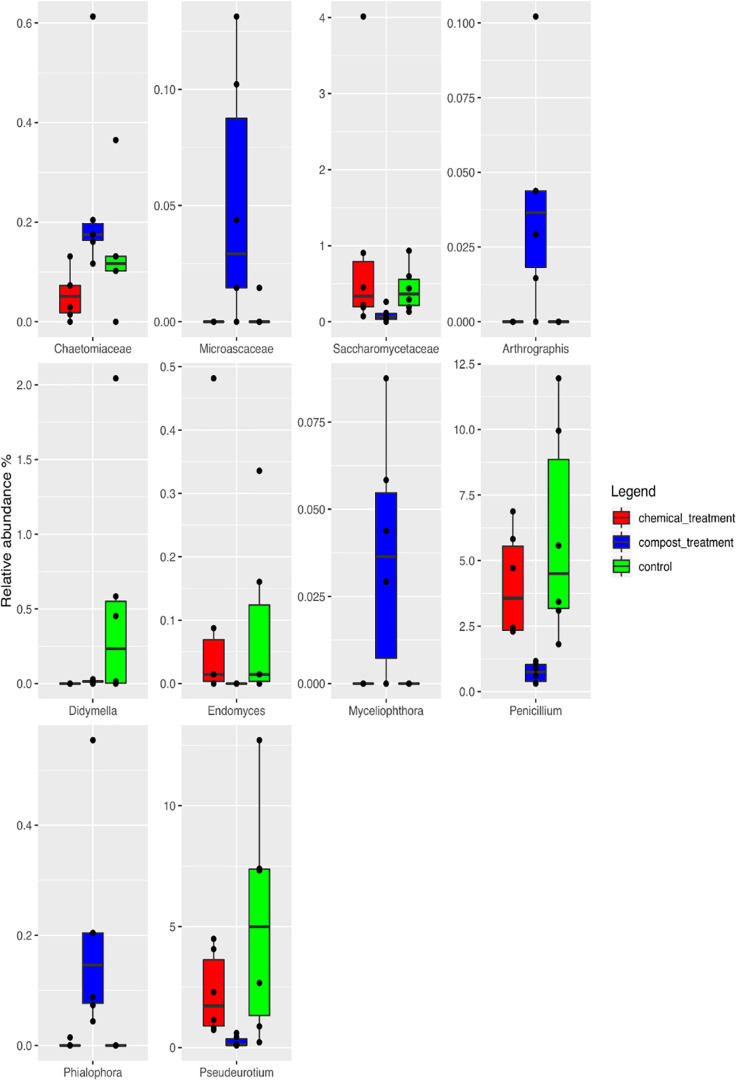
FIGURE 6.
Boxplots showing the relative abundance of the differentially abundant OTUs based on the Wilcoxon matched pairs test (FDR ≤ 0.05) of the rhizosphere soil samples at the end of the trials: untreated control (UC), chemical control (CC), and CM – 10% treatment. Three biological replicates were collected from three different pots per treatment and for each trial. The boxes represent the interquartile range (IQR) between the first and third quartiles, and the line inside represents the median (2ND quartile). The whiskers denote the lowest and the highest values within 1.56 IQR from the first and third quartiles, respectively. The circles represent outliers beyond the whiskers.

