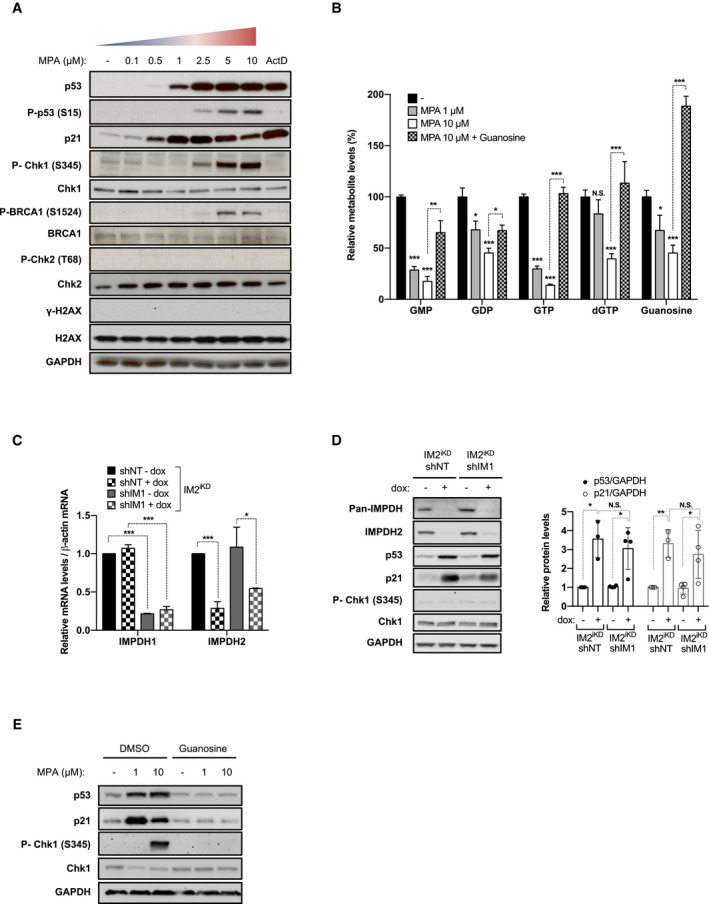
Figure 1. Inhibition of guanosine nucleotide synthesis elicits distinct p53 responses.

-
AWestern blots in HCT116 cells treated for 24 h with increasing concentrations of MPA or 5 nM Actinomycin D (ActD). GAPDH served as a loading control.
-
BHCT116 cells were treated for 24 h with vehicle alone (−), 1 μM MPA, 10 μM MPA, or the combination of 10 μM MPA with 400 μM guanosine. Guanylate nucleotide levels were measured by LC‐MS and normalized to protein content. Mean ± SEM is representative of 3 independent experiments carried out in triplicate.
-
C, DParental HCT116 cells expressing a stable tetracycline‐inducible shRNA against IMPDH2 (IM2iKD) and either a stable non‐targeting (NT) shRNA (IM2iKD‐shNT) or an shRNA targeting IMPDH1 (IM2iKD—shIM1) were grown for 7 days in the absence or presence of doxycycline (2 μg/ml) (− dox or + dox, respectively). mRNAs of IMPDH1 and IMPDH2 were quantified by real‐time qPCR in 2 independent experiments carried out in triplicate and normalized to β‐actin mRNA (C). Whole cell extracts were analyzed on Western blots with the indicated antibodies. GAPDH was used as a loading control. Quantification of band intensity of p53 and p21 is shown. Mean ± SD is representative of four independent experiments. (right panel) (D).
-
EWestern blots in HCT116 cells treated for 24 h with the indicated concentration of MPA, in the presence of dimethyl sulfoxide (DMSO) or 400 μM guanosine. GAPDH was used as a loading control.
