-
A
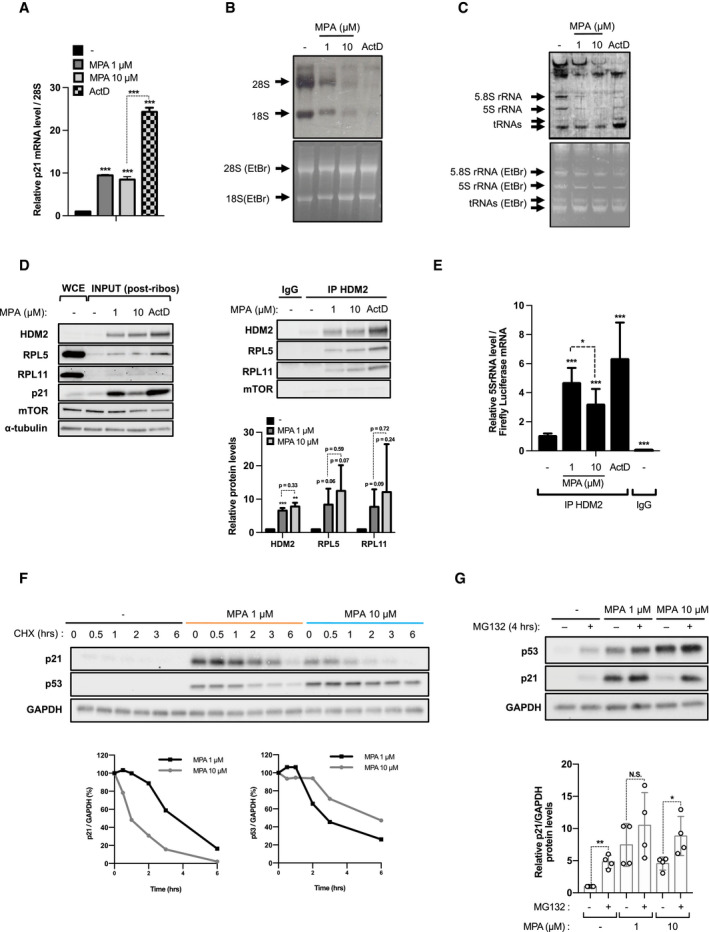
HCT116 cells were treated with either vehicle alone (−), 1 μM MPA, 10 μM MPA, or 5 nM ActD for 24 h and mRNA levels of p21 were quantified by real‐time qPCR in 2 independent experiments carried out in triplicate and normalized to 28S rRNA.
-
B
Autoradiogram (upper panel) and Ethidium Bromide (EtBr)‐stained agarose gel (lower panel) of 18S and 28S rRNA from HCT116 cells treated as indicated in the
Materials and Methods section.
-
C
Autoradiogram (upper panel) and EtBr‐stained TBE‐urea polyacrylamide gel (lower panel) of 5S, 5.8S rRNA and tRNAs in lysates from (B).
-
D, E
HCT116 cells were treated as in (B) for 24 h. Cell lysates were collected, subjected to ultracentrifugation, spiked with firefly luciferase mRNA, and immunoprecipitated with anti‐HDM2 rabbit antibody (IP HDM2) or the IgG control (IgG). (D) Levels of HDM2, RPL5, RPL11, and the IP‐negative control mTOR in the whole cell extract (WCE), the post‐ribosomal lysates (INPUT, left panel) and in the HDM2 immunoprecipitated fraction (right panel) were analyzed on Western blots. The results are representative of two independent experiments. Quantification of band intensity of HDM2, RPL5, and RPL11 of at least two independent experiments is shown (lower right panel). (E) Levels of immunoprecipitated 5S rRNA were determined by real‐time qPCR and normalized to the firefly luciferase mRNA. Data are normalized and presented as relative to untreated cells immunoprecipitated with anti‐HDM2. The results are representative of three independent experiments carried out in triplicates.
-
F
HCT116 cells were pretreated with vehicle alone (−), 1 μM, or 10 μM MPA for 24 h, and the levels of p53 and p21 were followed on Western blots in presence of 100 μg/ml cycloheximide (CHX) for the indicated time, in the continued presence of the treatment. GAPDH was used as a loading control. Quantification of band intensities is shown in the lower panels as relative to time 0 of CHX treatment.
-
G
HCT116 cells were pretreated as in (F), and 10 μM of the proteasome inhibitor MG132 was added for 4 h when indicated. The levels of p53 and p21 were analyzed on Western blots. GAPDH was used as a loading control. Quantification of p21 band intensity of at least four independent experiments is shown in the lower panel.
Data information: In panels (A, E, and G), data are presented as mean ± SD, relative to control. *
‐test.

