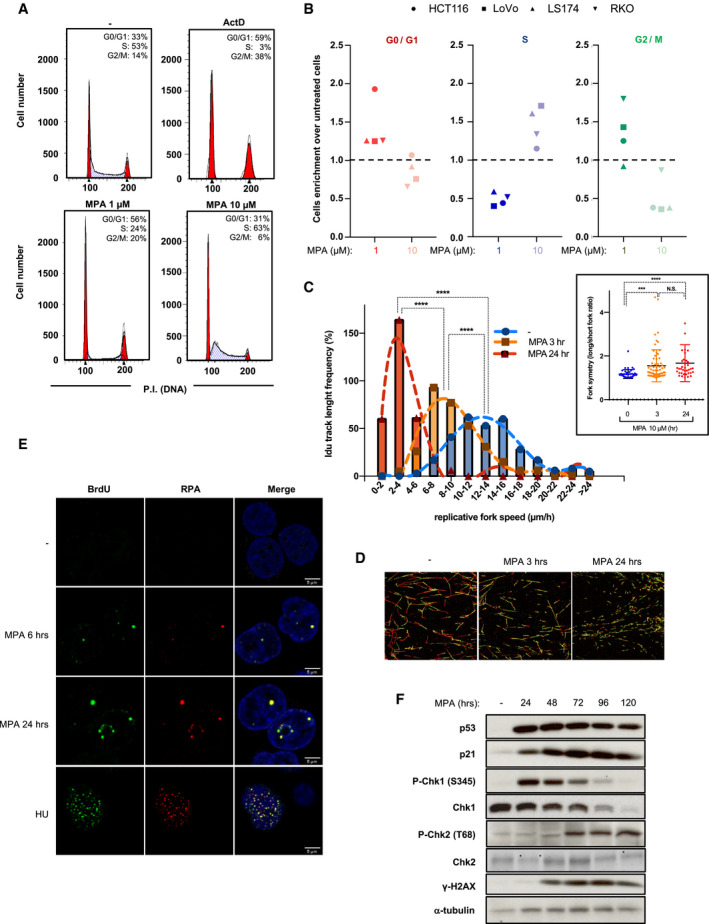
Figure 4. S phase entry and inhibition of DNA replication are induced at high concentrations of MPA .

- HCT116 were treated as indicated for 24 h, subjected to propidium iodide staining, and analyzed by fluorescence‐activated cell sorting (FACS). Data are representative of at least three independent experiments.
- Colon adenocarcinoma cell lines HCT116 (circles), LoVo (squares), LS174 (triangles), or RKO (inversed triangles) were treated with the vehicle alone (−), 1 μM MPA or 10 μM MPA for 24 h and subjected to propidium iodide staining and FACS analysis. Data are shown as the fold induction of the cell number in G0/G1 phases (blue), S phase (red), and G2/M phases upon treatment with 1 μM MPA (dark) or 10 μM MPA (clear) over vehicle‐treated cells.
- IdU track length distribution, and distribution of long fork/short fork IdU track length ratios (insert). IdU track length of at least 300 fibers was measured for each condition. For fork symmetry analyses, IdU track length was measure in at least 38 bidirectional forks (see Materials and Methods). ***P < 0.001, ****P < 0.0001 by Kruskal–Wallis test of the means.
- Representative images from (C).
- HCT116 cells, pre‐incubated with 10 μM BrdU for 48 h, were treated with Vehicle (−), 10 μM MPA for 6 or 24 h, or 20 μM Hydroxyurea for 4 h before cell permeabilization and fixation (see Materials and Methods). Cells were immunostained for native BrDU (green) or RPA (red). DNA was counterstained with DAPI (blue). One representative z‐confocal stack is shown per condition. Scale bars correspond to 5 μm.
- HCT116 cells treated with 10 μM MPA for increasing time were analyzed by Western blots for the indicated proteins. α‐tubulin was used as a loading control.
