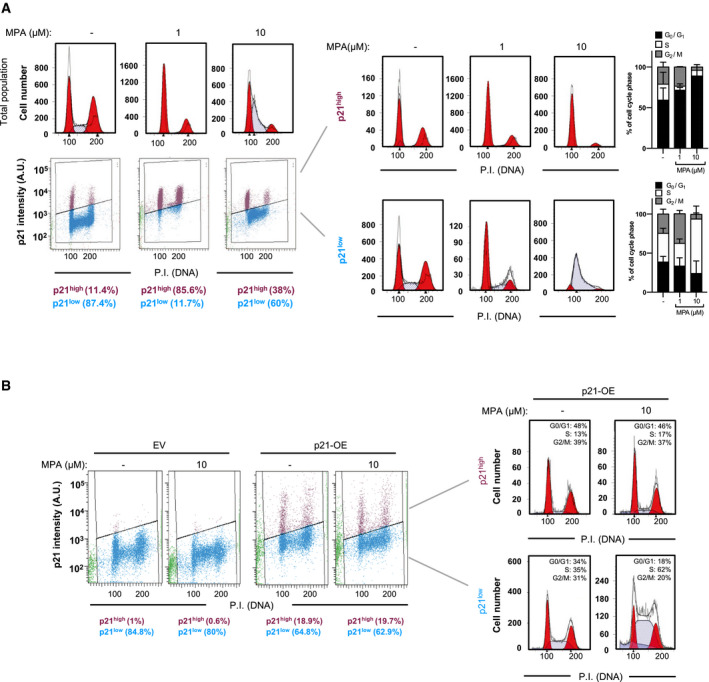
HCT116 cells were treated with either the vehicle alone (−), 1 μM MPA, or 10 μM MPA for 24 h, before p21 immunolabeling, propidium iodide staining, and FACS analysis. Cell‐cycle profiles of the total cell population (upper panel, left), the total intensity of p21, and propidium iodide were determined in 20,000 cells and plotted in a scatter diagram (lower panel, left). The specific cell‐cycle profiles are shown of p21high (upper panel, right) and p21low (lower panel, right) cell populations. Mean ± SD of the percentage of cells in each cell‐cycle phase of at least two independent experiments is shown in the right panels.

