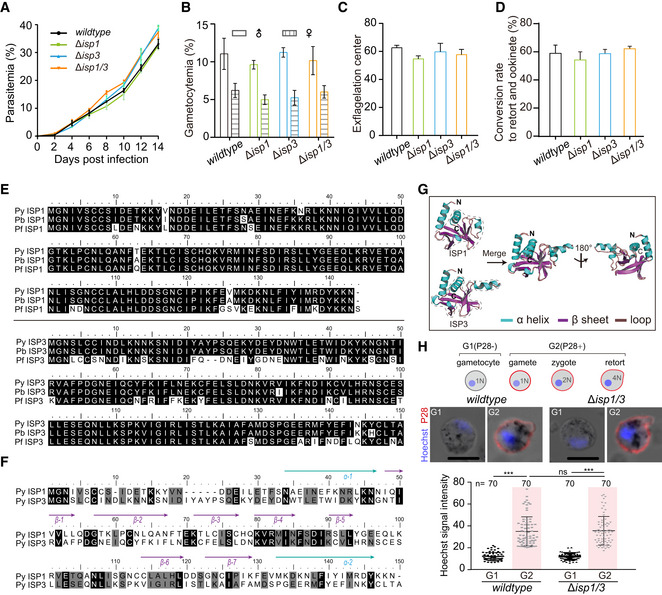
Parasitemia in mouse. Values are means ± SEM (n = 3 biological replicates).
Gametocytemia in mouse. Values are means ± SEM (n = 3 biological replicates).
Male gametocyte activation in vitro by counting the exflagellation centers formed. Values are means ± SEM (n = 3 biological replicates).
In vitro differentiation to retort and ookinete. Values are means ± SEM (n = 3 biological replicates).
Alignment of ISP1 (up panel) or ISP3 (lower panel) protein sequences from P. yoelii, P. berghei, and P. falciparum. pyisp1: PY17X_1212600; pbisp1: PBANKA_1209400; pfisp1: PF3D7_1011000; pyisp3: PY17X_1328100; pbisp3: PBANKA_1324300; pfisp3: PF3D7_1460600.
Second structure‐based sequence alignment of ISP1 and ISP3 protein of P. yoelii.
Predicted structures of P. yoelii ISP1 and ISP3. The structures of Plasmodium ISP1 and ISP3 are constructed using homology modeling with SWISS‐MODEL based on protein structures of T. gondii ISP1 (PDB: 4chm) and ISP3 (PDB: 4chj). Both protein structures of ISP1 and ISP3 display a character of the pleckstrin homology (PH) domain (indicated by dashed line), composing one α‐helix and six β‐sheets. The α‐helix is shown in green, β‐sheet in purple, and loop in brown.
Nuclei DNA content analysis of parasite. Upper panel indicates the schematic of female gametocyte–female gamete–zygote–retort/ookinete differentiation. One female gamete (1N) fertilizes with one male gamete to form zygote (2N) and further develop to retort/ookinete (4N) by meiotic DNA replication. P28 and Hoechst 33342 staining of female gametocyte, female gamete, zygote, and retort of WT and Δisp1/3 parasites. Zygotes and retorts were collected at 4 h post‐activation. Scale bar = 5 μm. Lower panel indicates the quantification of the Hoechst fluorescence signals. Values are mean ± SD (n is the number of cells measured in each group). Mann–Whitney test, ***P < 0.001. Three biological replicates performed.

